Краткий конспект реализации Garbage Collector в Java
Garbage Collector (GB) часть JVM, который призван очищать память, выделенную приложению. Он должен:
- найти мусор (неиспользуемые объекты)
- удалить мусор
Есть различные реализации GB.
Поиск мусора
- Reference counting — у каждого объекта счетчик ссылок. Когда он равен нулю, объект считается мусором. Проблема такого подхода в том, что могут быть цикличные ссылки у объектов друг на друга, в то время как они фактически мусор и не используются программой.
- Tracing — объект считается не мусором, если до него можно добраться с корневых точек (GC Root: локальные переменные и параметры методов, java-потоки, статичные переменные, ссылки из JNI.
Организация памяти JVM
Делится на две части:
- Heap — куча. Основной сегмент памяти, где содержатся все объекты и происходит сборка мусора.
- Permanent Generation — содержит мета-данные классов.
Сразу про Permanent Generation. Может менять размер во время выполнения, и это довольно дорогостоящая операция. Размер настраивается (-XX: PermSize — мин размер, -XX: MaxSize — макс размер). Часто мин = макс.
Heap. Куча. Тут и работает GC.
Делится на две области:
- New (Yang) Generation — объекты, кот. тут считаются короткоживущими.
- Old Generation (Tenured) — обекты считаются долгоживущими.
Алгоритм GC исходит из того предположения, что большинство java-объектов живут недолго. Быстро становятся мусором. От них необходимо довольно оперативно избавляться. Что и происходит в New Generation. Там сбор мусора гораздо чаще, чем в Old Generation, где хранятся долгоживущие объекты. После создания объект попадает в New Generation и имеет шанс попасть в Old Generation по прошествии некоторого времени (циклов GC).
Heap состоит из:
- Eden — переводится как Едем (?). Сюда аллоцируются объекты. Если нет места запускается GC.
- Survivor — точнее их два, S1 и S2, и они меняются ролями. Хранятся объекты, которые признаются живыми во время GC.
Размер Heap настраивается.
Принцип работы 4 сборщиков HotSpot VM (одна из JVM)
- Serial
- Parallel
- Concurent Mark Sweep (CMS)
- Garbage-First (G1)
Serial. Когда нет места в Eden, запускается GC, живые объекты коприруются в S1. Вся область Eden очищается. S1 и S2 меняются местами. При последующих циклах в S1 будут записаны живые объекты как из Eden, так и из S2. После нескольких циклов обмена S1 и S2 или заполнения области S2, обекты, которые живут достаточно долго перемещаются в Old Greneration.
Следует сказать, что не всегда объекты при создании аллоцируюся в Eden. Если объект слишком велик, он сразу идет в Old Generation.
Когда после очередной сборки мусора места нехватает уже в New Generation, то запускается сбор мусора в Old Generation (наряду со сборкой New Generation). В old Generation объекты уплотняются (алгоритм Mark-Sweep-Compact).
Если после полной сборки мусора места нехватает, то вылетает Java.lang.OutOfMemoryError.
Но во время работы VW может запрашивать увеличение памяти и Heap может увеличиваться.
Как правило, Old Generation занимает 2/3 объема Heap.
Эффективоность алгоритма сборки мусора считается по параметру STW (Stop The World) — время, когда все процессы кроме GC останавливаются. Serial в этом смысле не слишком эффективен, т.к. делает свою работу не торопясь, в одном потоке.
Parallel. То же, что и Serial, но использует для работы несколько потоков. Таким образом STW чуть меньше.
Concurent Mark Sweep. Принцип работы с New Generation такой же, как и в случае алгоритмов Serial и Parallel, отличия в том, что данный алгоритм разделяет младшую (New Generation) и старшую (Old Generation) сборку мусора во времени. Причем сбор мусора в Old Generation происходит в отдельном потоке, независимо от младшей сборки. При этом сначала приложение останавливается, сборщик помечает все живые объекты доступные из GC Root (корневых точек) напрямую, затем приложение вновь начинает работу, а сбощик проверяет объекты доступные по ссылкам из этих самых помеченных, и также помечает их как живые. Эта особенность создает так называемые плавающие объекты, которые помечены как живые, но таковыми по факту не являющимися. Но они будут удалены в следующих циклах. Т.е. пропускная способность растет, STW уменьшается, но требутся больше места для хранения плавающих объектов.
В этом алгоритме уплотнения нет. Т.е. область Old Generation дефрагментированна.
Garbage-First. G1 сильно отличается от своих предшественников. Он делит область Heap не физически, а скорее логически на те же области: Eden, Survivor, Old Generation. Причем дефрагментированно. Физически область Heap делится на регионы одинакового размера, каждый из которых может быть Eden, Survivor или Old Generation + область для больших объектов (громадный регион).
Над очисткой регионов Eden работает сразу несколько потоков, объекты переносятся в регионы Survivor или регионы старшего поколения (Tenured). Это знакомый по предыдущим алгоритмам очистки подход. На время очистки работа приложения останавливается. Отличие в том, что очистка производится не по всем регионам Eden, а только по некоторым, которые более всего в ней нуждаются, таким образом регулируется время очистки. Отсюда название алгоритма — в первую очередь мусор.
А с полной сборкой (точнее, здесь она называется смешанной (mixed)) все немного хитроумнее, чем в рассмотренных ранее сборщиках. В G1 существует процесс, называемый циклом пометки (marking cycle), который работает параллельно с основным приложением и составляет список живых объектов. За исключением последнего пункта, этот процесс выглядит уже знакомо для нас:
- Initial mark. Пометка корней (с остановкой основного приложения) с использованием информации, полученной из малых сборок.
- Concurrent marking. Пометка всех живых объектов в куче в нескольких потоках, параллельно с работой основного приложения.
- Remark. Дополнительный поиск не учтенных ранее живых объектов (с остановкой основного приложения).
- Cleanup. Очистка вспомогательных структур учета ссылок на объекты и поиск пустых регионов, которые уже можно использовать для размещения новых объектов. Первая часть этого шага выполняется при остановленном основном приложении.
После окончания цикла пометки G1 переключается на выполнение смешанных сборок. Это значит, что при каждой сборке к набору регионов младшего поколения, подлежащих очистке, добавляется некоторое количество регионов старшего поколения. Количество таких сборок и количество очищаемых регионов старшего поколения выбирается исходя из имеющейся у сборщика статистики о предыдущих сборках таким образом, чтобы не выходить за требуемое время сборки. Как только сборщик очистил достаточно памяти, он переключается обратно в режим малых сборок.
Очередной цикл пометки и, как следствие, очередные смешанные сборки будут запущены тогда, когда заполненность кучи превысит определенный порог.
Опираясь на уже упомянутую статистику о предыдущих сборках, G1 может менять количество регионов, закрепленных за определенным поколением, для оптимизации будущих сборок.
Громадные регионы. С точки зрения JVM объекты которые превышают размер половины региона являются громадными. Особенности:
- никогда не перемещается между регионами
- может удаляться в рамках цикла пометки или полной сборки мусора
- в регионе, занятом громадным объектом, может находится только он сам.
Громадные объекты в силу небольшого размера регионов могут порождать проблемы с точки зрения STW.
G1 выигрывает по времени STW, но расплатой является меньшая пропускная способность (около 90%, ср., например у Paraller ок. 99%) т.е. большие затраты ресурсов процессора.
Bonus
Вопрос: Расскажите почему именно два региона survival и зачем перекладывать объекты между ними?
Ответ:
Представьте себя на месте сборщика. У вас есть регион памяти, который нужно очистить. После удаления мусора регион оказывается сильно дефрагментированным и если вы хотите это исправить, то у вас есть два варианта: либо уплотнять объекты в рамках этого же региона, либо скопировать их в другой, пока еще пустой регион, располагая один-к-одному, а старый регион объявить пустым. Но задача осложняется тем, что объекты ссылаются друг на друга и при перемещении любого объекта необходимо производить обновление всех имеющихся на него ссылок. И вот эту задачу намного легче решать при копировании, причем сразу объединяя ее с задачей поиска живых объектов:
Вы просто заводите два указателя на начало новой области. Первый указатель (назовем его T) смещается вправо каждый раз, когда в новую область копируется объект, то есть он всегда указывает на первый свободный блок новой области. При этом на том месте старой области, где находился перемещаемый объект, мы делаем пометку о том, что он был перемещен, и там же оставляем его новый адрес. Первым делом перемещаем таким образом все руты из старой области в новую. И вот тут вступает в действие второй указатель (назовем его R). Он тоже начинает смещаться вправо по уже размещенным в новой области объектам. В каждом объекте он ищет ссылки на другие объекты и смотрит на то место в старом регионе, куда они указывают. Если там стоит метка о перемещении и новый адрес, то этот адрес используется для подмены. Если же там лежит объект, то он перемещается в новый регион, на его месте ставится метка и новый адрес, на который так же заменяется ссылка, по которой его нашли, при этом T опять смещается вправо. Как только R догонит T, окажется, что мы собрали все живые объекты в новой области, размещенные компактно, да еще и с корректно обновленными ссылками, а старый регион можем объявить пустым. Все быстро и просто.
Java garbage collector как работает
Garbage collection in Java is the process by which Java programs perform automatic memory management. Java programs compile to bytecode that can be run on a Java Virtual Machine, or JVM for short. When Java programs run on the JVM, objects are created on the heap, which is a portion of memory dedicated to the program. Eventually, some objects will no longer be needed. The garbage collector finds these unused objects and deletes them to free up memory.
What is Garbage Collection?
In C/C++, a programmer is responsible for both the creation and destruction of objects. Usually, programmer neglects the destruction of useless objects. Due to this negligence, at a certain point, sufficient memory may not be available to create new objects, and the entire program will terminate abnormally, causing OutOfMemoryErrors.
But in Java, the programmer need not care for all those objects which are no longer in use. Garbage collector destroys these objects. The main objective of Garbage Collector is to free heap memory by destroying unreachable objects. The garbage collector is the best example of the Daemon thread as it is always running in the background.
How Does Garbage Collection in Java works?
Java garbage collection is an automatic process. Automatic garbage collection is the process of looking at heap memory, identifying which objects are in use and which are not, and deleting the unused objects. An in-use object, or a referenced object, means that some part of your program still maintains a pointer to that object. An unused or unreferenced object is no longer referenced by any part of your program. So the memory used by an unreferenced object can be reclaimed. The programmer does not need to mark objects to be deleted explicitly. The garbage collection implementation lives in the JVM.
Types of Activities in Java Garbage Collection
Two types of garbage collection activity usually happen in Java. These are:
- Minor or incremental Garbage Collection: It is said to have occurred when unreachable objects in the young generation heap memory are removed.
- Major or Full Garbage Collection: It is said to have occurred when the objects that survived the minor garbage collection are copied into the old generation or permanent generation heap memory are removed. When compared to the young generation, garbage collection happens less frequently in the old generation.
Important Concepts Related to Garbage Collection in Java
1. Unreachable objects: An object is said to be unreachable if it doesn’t contain any reference to it. Also, note that objects which are part of the island of isolation are also unreachable.

2. Eligibility for garbage collection: An object is said to be eligible for GC(garbage collection) if it is unreachable. After i = null, integer object 4 in the heap area is suitable for garbage collection in the above image.
Ways to make an object eligible for Garbage Collector
- Even though the programmer is not responsible for destroying useless objects but it is highly recommended to make an object unreachable(thus eligible for GC) if it is no longer required.
- There are generally four ways to make an object eligible for garbage collection.
- Nullifying the reference variable
- Re-assigning the reference variable
- An object created inside the method
- Island of Isolation
Ways for requesting JVM to run Garbage Collector
- Once we make an object eligible for garbage collection, it may not destroy immediately by the garbage collector. Whenever JVM runs the Garbage Collector program, then only the object will be destroyed. But when JVM runs Garbage Collector, we can not expect.
- We can also request JVM to run Garbage Collector. There are two ways to do it :
- UsingSystem.gc()method: System class contain static method gc() for requesting JVM to run Garbage Collector.
- UsingRuntime.getRuntime().gc()method:Runtime class allows the application to interface with the JVM in which the application is running. Hence by using its gc() method, we can request JVM to run Garbage Collector.
- There is no guarantee that any of the above two methods will run Garbage Collector.
- The call System.gc() is effectively equivalent to the call : Runtime.getRuntime().gc()
Finalization
- Just before destroying an object, Garbage Collector calls finalize() method on the object to perform cleanup activities. Once finalize() method completes, Garbage Collector destroys that object.
- finalize() method is present in Object class with the following prototype.
Based on our requirement, we can override finalize() method for performing our cleanup activities like closing connection from the database.
- The finalize() method is called by Garbage Collector, not JVM. However, Garbage Collector is one of the modules of JVM.
- Object class finalize() method has an empty implementation. Thus, it is recommended to override the finalize() method to dispose of system resources or perform other cleanups.
- The finalize() method is never invoked more than once for any object.
- If an uncaught exception is thrown by the finalize() method, the exception is ignored, and the finalization of that object terminates.
Advantages of Garbage Collection in Java
The advantages of Garbage Collection in Java are:
- It makes java memory-efficient because the garbage collector removes the unreferenced objects from heap memory.
- It is automatically done by the garbage collector(a part of JVM), so we don’t need extra effort.
Real-World Example
Let’s take a real-life example, where we use the concept of the garbage collector.
Question: Suppose you go for the internship at GeeksForGeeks, and you were told to write a program to count the number of employees working in the company(excluding interns). To make this program, you have to use the concept of a garbage collector.
This is the actual task you were given at the company:
Write a program to create a class called Employee having the following data members.
1. An ID for storing unique id allocated to every employee.
2. Name of employee.
3. age of an employee.
Also, provide the following methods:
- A parameterized constructor to initialize name and age. The ID should be initialized in this constructor.
- A method show() to display ID, name, and age.
- A method showNextId() to display the ID of the next employee.
Now any beginner, who doesn’t know Garbage Collector in Java will code like this:
Java Garbage Collection Basics
This tutorial covers the basics of how Garbage Collection works with the Hotspot JVM. Once you have learned how the garbage collector functions, learn how to monitor the garbage collection process using Visual VM. Finally, learn which garbage collectors are available in the Java SE 7 Hotspot JVM.
Time to Complete
Approximately 1 hour
Introduction
This OBE covers the basics of Java Virtual Machine(JVM) Garbage Collection (GC) in Java. In the first part of the OBE, an overview of the JVM is provided along with an introduction to Garbage Collection and performance. Next students are provided a step by step guide to how Garbage Collection works inside the JVM. Next a hands on activity is provided for learners to try out some of the monitoring tools provided in the Java JDK and put what they have just learned about Garbage Collection into practice. Finally, a section is provided covering the Garbage Collection scheme options available in the Hotspot JVM.
Hardware and Software Requirements
The following is a list of hardware and software requirements:
- A PC running Windows XP or later, Mac OS X or Linux. Note that the hands on is done with Windows 7 and has not been tested on all platforms. However, everything should work fine on OS X or Linux. Also a machine with more than one core is preferable.
- Java 7 Update 7 or later
- The latest Java 7 Demos and Samples Zip file
Prerequisites
Before starting this tutorial, you should:
- If you have not done so, download and install the latest version of the Java JDK (JDK 7 u7 or later).
Java 7 JDK Downloads - Download and install the Demos and Samples zip file from the same location. Unzip the file and place the contents in a directory. For example: C:\javademos
Java Technology and the JVM
Java Overview
Java is a programming language and computing platform first released by Sun Microsystems in 1995. It is the underlying technology that powers Java programs including utilities, games, and business applications. Java runs on more than 850 million personal computers worldwide, and on billions of devices worldwide, including mobile and TV devices. Java is composed of a number of key components that, as a whole, create the Java platform.
Java Runtime Edition
When you download Java, you get the Java Runtime Environment (JRE). The JRE consists of the Java Virtual Machine (JVM), Java platform core classes, and supporting Java platform libraries. All three are required to run Java applications on your computer. With Java 7, Java applications run as desktop applications from the operating system, as a desktop application but installed from the Web using Java Web Start, or as a Web Embedded application in a browser (using JavaFX).
Java Programming Language
Java is an object-oriented programming language that includes the following features.
- Platform Independence — Java applications are compiled into bytecode which is stored in class files and loaded in a JVM. Since applications run in a JVM, they can be run on many different operating systems and devices.
- Object-Oriented — Java is an object-oriented language that take many of the features of C and C++ and improves upon them.
- Automatic Garbage Collection — Java automatically allocates and deallocates memory so programs are not burdened with that task.
- Rich Standard Library — Java includes a vast number of premade objects that can be used to perform such tasks as input/output, networking, and date manipulation.
Java Development Kit
The Java Development Kit (JDK) is a collection of tools for developing Java applications. With the JDK, you can compile programs written in the Java Programming language and run them in a JVM. In addition, the JDK provides tools for packaging and distributing your applications.
The JDK and the JRE share the Java Application Programming Interfaces (Java API). The Java API is a collection of prepackaged libraries developers use to create Java applications. The Java API makes development easier by providing the tools to complete many common programming tasks including string manipulation, date/time processing, networking, and implementing data structures (e.g., lists, maps, stacks, and queues).
Java Virtual Machine
The Java Virtual Machine (JVM) is an abstract computing machine. The JVM is a program that looks like a machine to the programs written to execute in it. This way, Java programs are written to the same set of interfaces and libraries. Each JVM implementation for a specific operating system, translates the Java programming instructions into instructions and commands that run on the local operating system. This way, Java programs achieve platform independence.
The first prototype implementation of the Java virtual machine, done at Sun Microsystems, Inc., emulated the Java virtual machine instruction set in software hosted by a handheld device that resembled a contemporary Personal Digital Assistant (PDA). Oracle’s current implementations emulate the Java virtual machine on mobile, desktop and server devices, but the Java virtual machine does not assume any particular implementation technology, host hardware, or host operating system. It is not inherently interpreted, but can just as well be implemented by compiling its instruction set to that of a silicon CPU. It may also be implemented in microcode or directly in silicon.
The Java virtual machine knows nothing of the Java programming language, only of a particular binary format, the class file format. A class file contains Java virtual machine instructions (or bytecodes) and a symbol table, as well as other ancillary information.
For the sake of security, the Java virtual machine imposes strong syntactic and structural constraints on the code in a class file. However, any language with functionality that can be expressed in terms of a valid class file can be hosted by the Java virtual machine. Attracted by a generally available, machine-independent platform, implementors of other languages can turn to the Java virtual machine as a delivery vehicle for their languages. (1) The Java Virtual Machine
Exploring the JVM Architecture
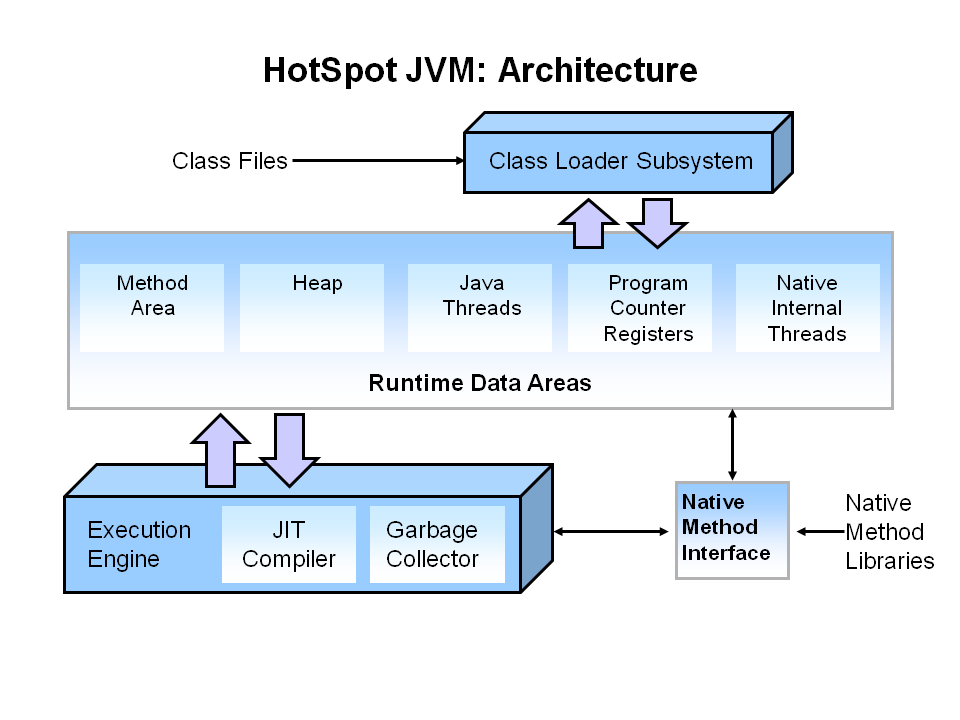
Hotspot Architecture
The HotSpot JVM possesses an architecture that supports a strong foundation of features and capabilities and supports the ability to realize high performance and massive scalability. For example, the HotSpot JVM JIT compilers generate dynamic optimizations. In other words, they make optimization decisions while the Java application is running and generate high-performing native machine instructions targeted for the underlying system architecture. In addition, through the maturing evolution and continuous engineering of its runtime environment and multithreaded garbage collector, the HotSpot JVM yields high scalability on even the largest available computer systems.

The main components of the JVM include the classloader, the runtime data areas, and the execution engine.
Key Hotspot Components
The key components of the JVM that relate to performance are highlighted in the following image.
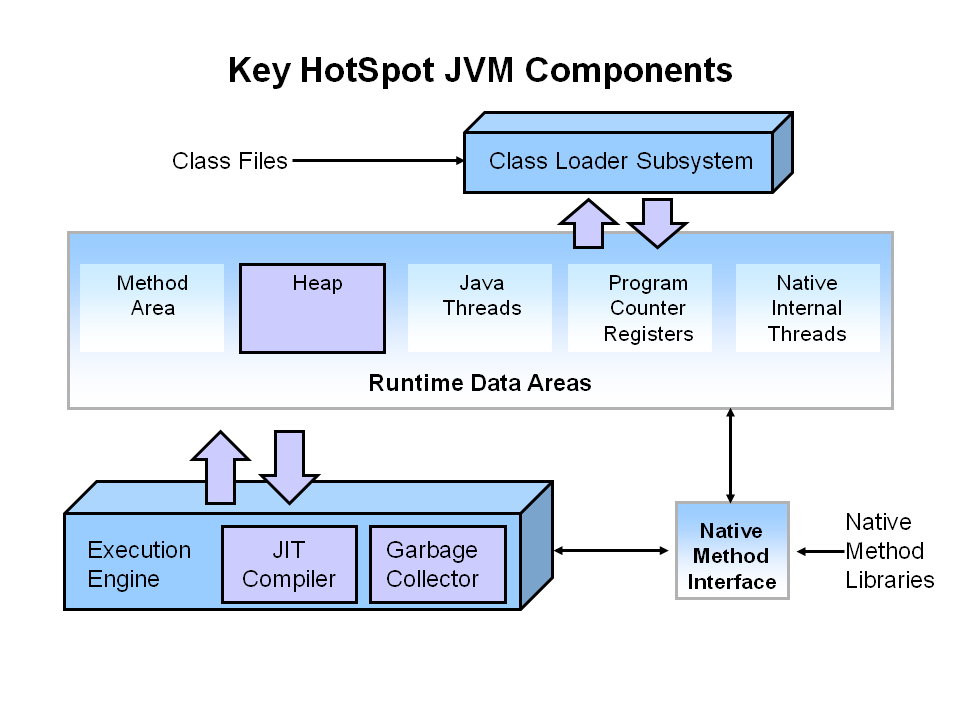
There are three components of the JVM that are focused on when tuning performance. The heap is where your object data is stored. This area is then managed by the garbage collector selected at startup. Most tuning options relate to sizing the heap and choosing the most appropriate garbage collector for your situation. The JIT compiler also has a big impact on performance but rarely requires tuning with the newer versions of the JVM.
Performance Basics
Typically, when tuning a Java application, the focus is on one of two main goals: responsiveness or throughput. We will refer back to these concepts as the tutorial progresses.
Responsiveness
Responsiveness refers to how quickly an application or system responds with a requested piece of data. Examples include:
- How quickly a desktop UI responds to an event
- How fast a website returns a page
- How fast a database query is returned
For applications that focus on responsiveness, large pause times are not acceptable. The focus is on responding in short periods of time.
Throughput
Throughput focuses on maximizing the amount of work by an application in a specific period of time. Examples of how throughput might be measured include:
- The number of transactions completed in a given time.
- The number of jobs that a batch program can complete in an hour.
- The number of database queries that can be completed in an hour.
High pause times are acceptable for applications that focus on throughput. Since high throughput applications focus on benchmarks over longer periods of time, quick response time is not a consideration.
Describing Garbage Collection
What is Automatic Garbage Collection?
Automatic garbage collection is the process of looking at heap memory, identifying which objects are in use and which are not, and deleting the unused objects. An in use object, or a referenced object, means that some part of your program still maintains a pointer to that object. An unused object, or unreferenced object, is no longer referenced by any part of your program. So the memory used by an unreferenced object can be reclaimed.
In a programming language like C, allocating and deallocating memory is a manual process. In Java, process of deallocating memory is handled automatically by the garbage collector. The basic process can be described as follows.
Step 1: Marking
The first step in the process is called marking. This is where the garbage collector identifies which pieces of memory are in use and which are not.
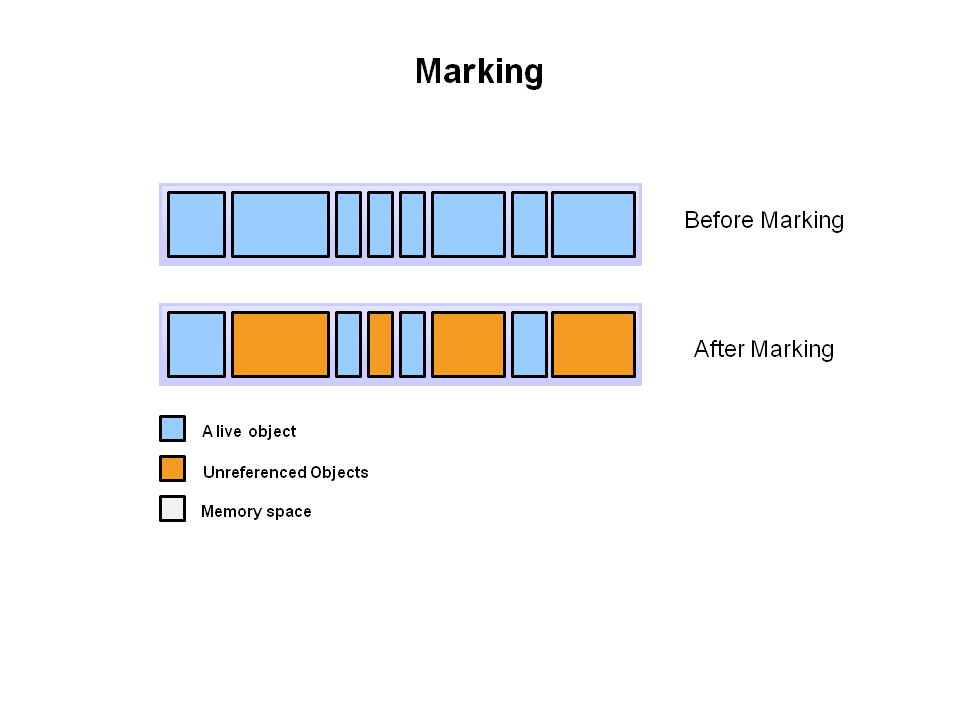
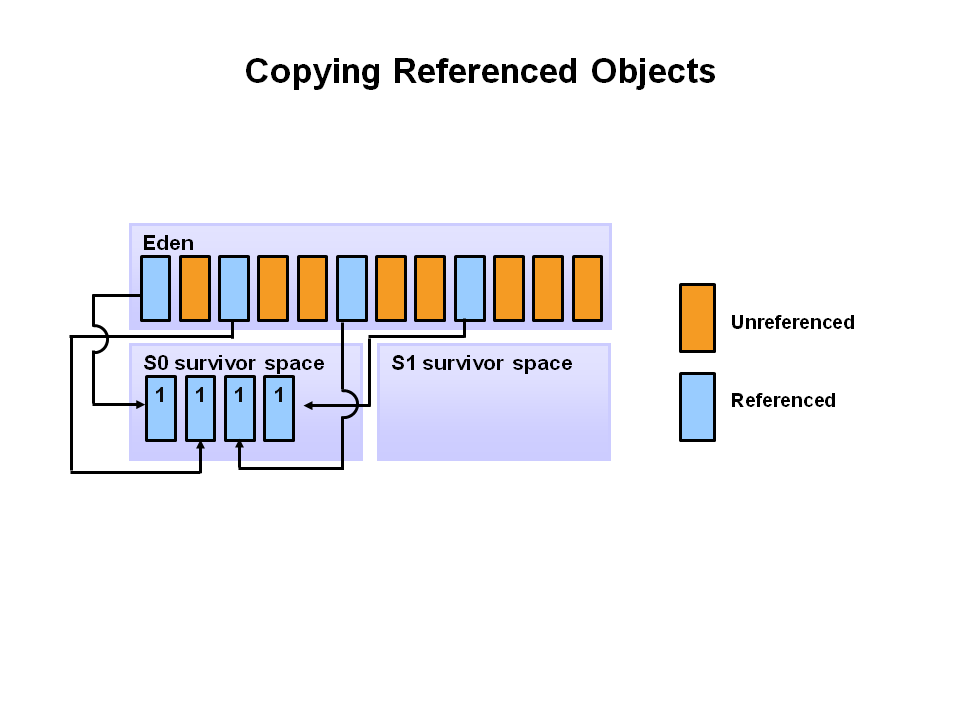
Referenced objects are shown in blue. Unreferenced objects are shown in gold. All objects are scanned in the marking phase to make this determination. This can be a very time consuming process if all objects in a system must be scanned.
Step 2: Normal Deletion
Normal deletion removes unreferenced objects leaving referenced objects and pointers to free space.
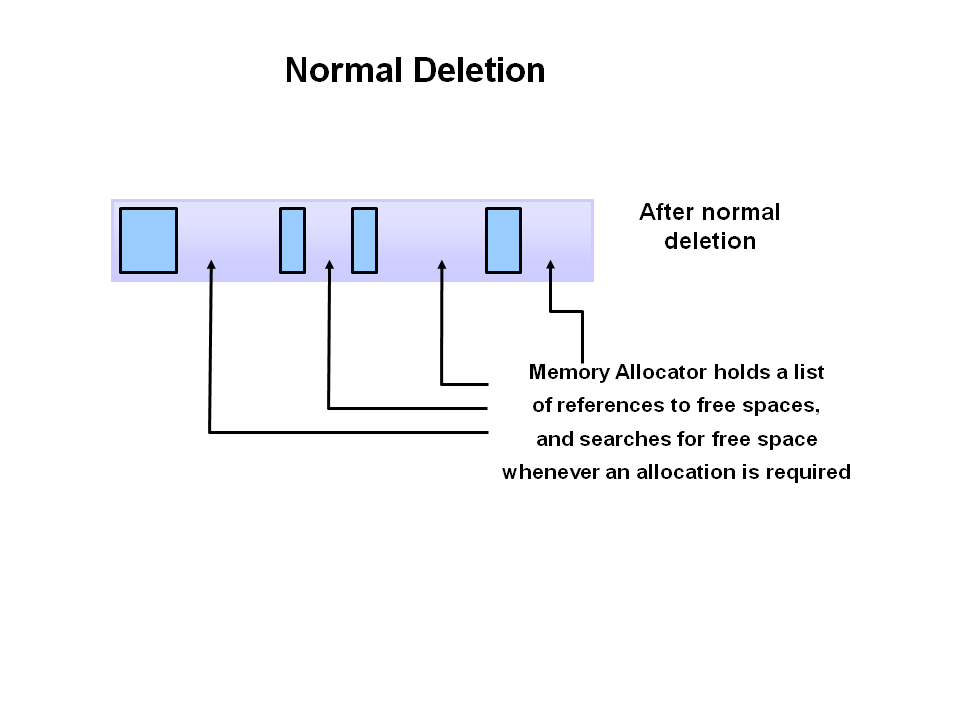
The memory allocator holds references to blocks of free space where new object can be allocated.
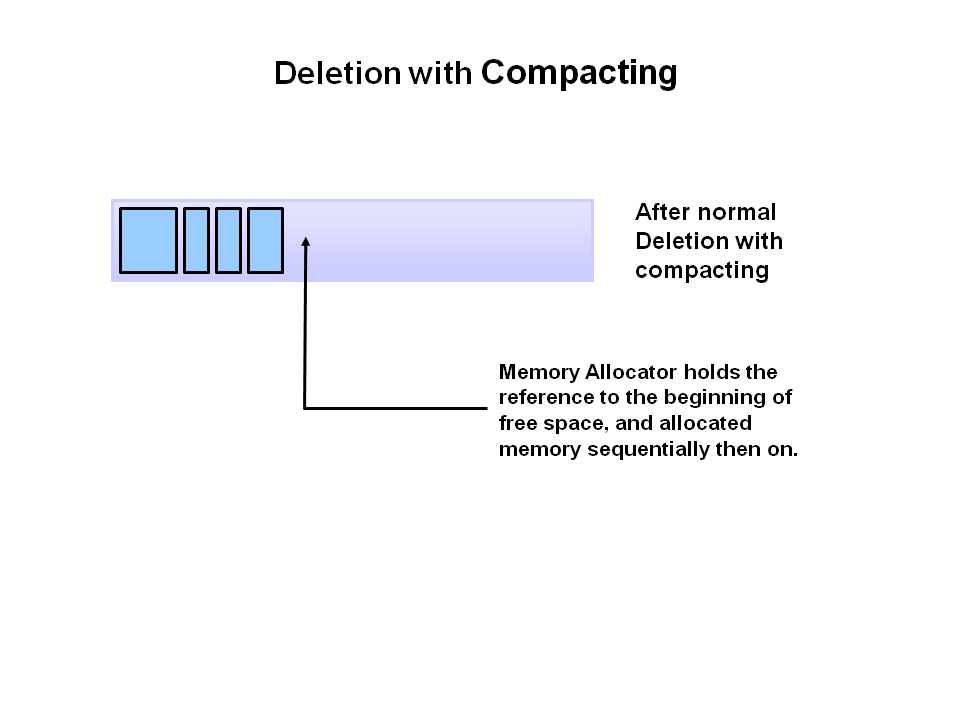
Step 2a: Deletion with Compacting
To further improve performance, in addition to deleting unreferenced objects, you can also compact the remaining referenced objects. By moving referenced object together, this makes new memory allocation much easier and faster.
Why Generational Garbage Collection?
As stated earlier, having to mark and compact all the objects in a JVM is inefficient. As more and more objects are allocated, the list of objects grows and grows leading to longer and longer garbage collection time. However, empirical analysis of applications has shown that most objects are short lived.
Here is an example of such data. The Y axis shows the number of bytes allocated and the X access shows the number of bytes allocated over time.
As you can see, fewer and fewer objects remain allocated over time. In fact most objects have a very short life as shown by the higher values on the left side of the graph.
JVM Generations
The information learned from the object allocation behavior can be used to enhance the performance of the JVM. Therefore, the heap is broken up into smaller parts or generations. The heap parts are: Young Generation, Old or Tenured Generation, and Permanent Generation
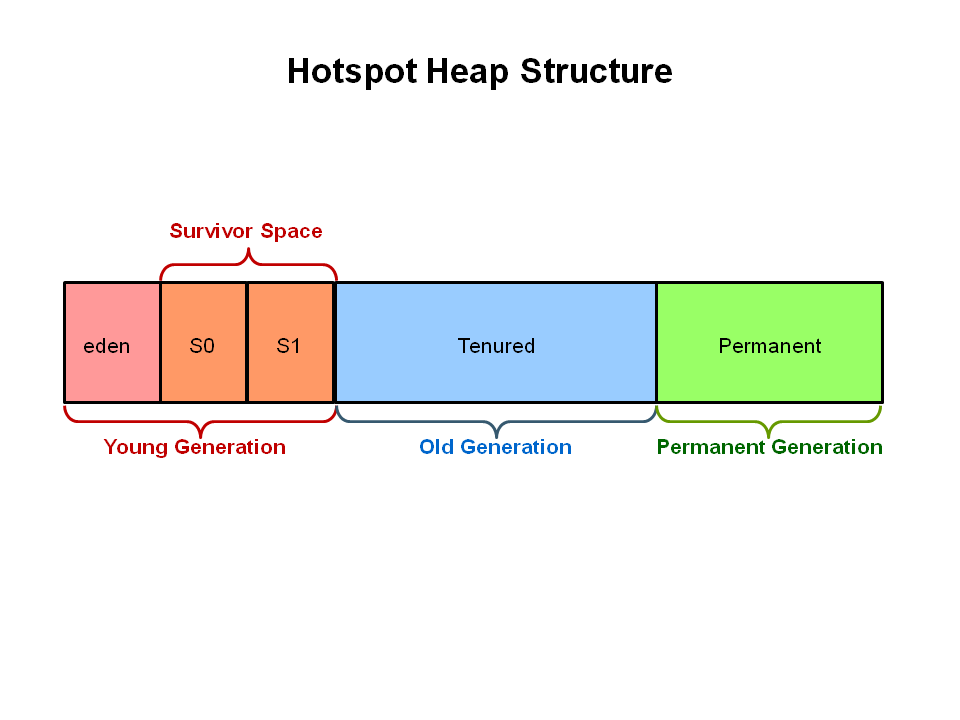
The Young Generation is where all new objects are allocated and aged. When the young generation fills up, this causes a minor garbage collection. Minor collections can be optimized assuming a high object mortality rate. A young generation full of dead objects is collected very quickly. Some surviving objects are aged and eventually move to the old generation.
Stop the World Event — All minor garbage collections are «Stop the World» events. This means that all application threads are stopped until the operation completes. Minor garbage collections are always Stop the World events.
The Old Generation is used to store long surviving objects. Typically, a threshold is set for young generation object and when that age is met, the object gets moved to the old generation. Eventually the old generation needs to be collected. This event is called a major garbage collection.
Major garbage collection are also Stop the World events. Often a major collection is much slower because it involves all live objects. So for Responsive applications, major garbage collections should be minimized. Also note, that the length of the Stop the World event for a major garbage collection is affected by the kind of garbage collector that is used for the old generation space.
The Permanent generation contains metadata required by the JVM to describe the classes and methods used in the application. The permanent generation is populated by the JVM at runtime based on classes in use by the application. In addition, Java SE library classes and methods may be stored here.
Classes may get collected (unloaded) if the JVM finds they are no longer needed and space may be needed for other classes. The permanent generation is included in a full garbage collection.
The Generational Garbage Collection Process
Now that you understand why the heap is separted into different generations, it is time to look at how exactly these spaces interact. The pictures that follow walks through the object allocation and aging process in the JVM.
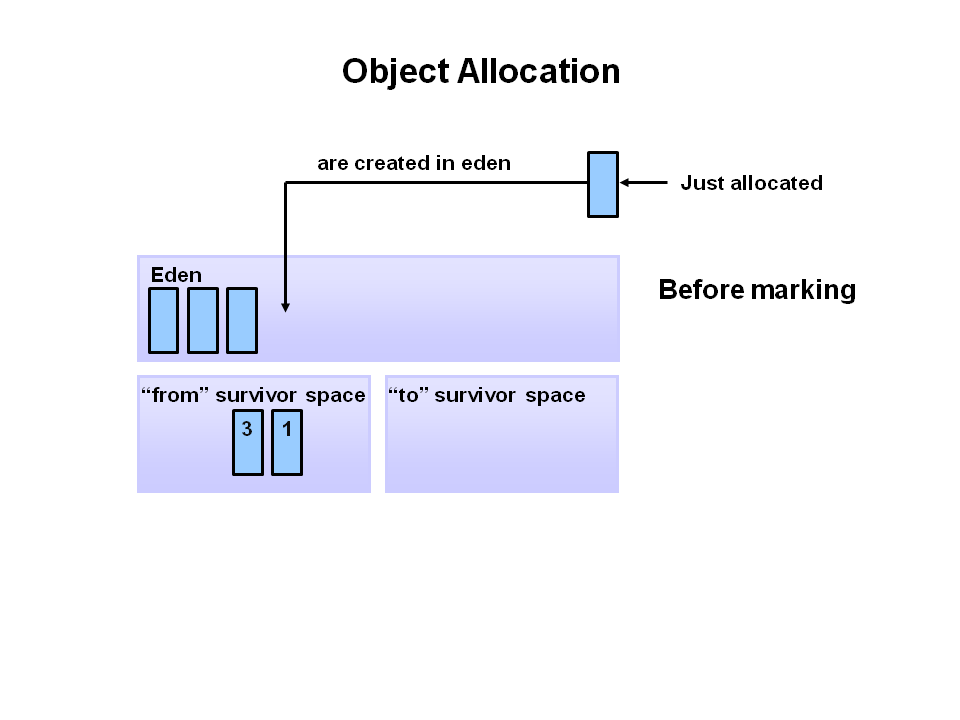
First, any new objects are allocated to the eden space. Both survivor spaces start out empty.
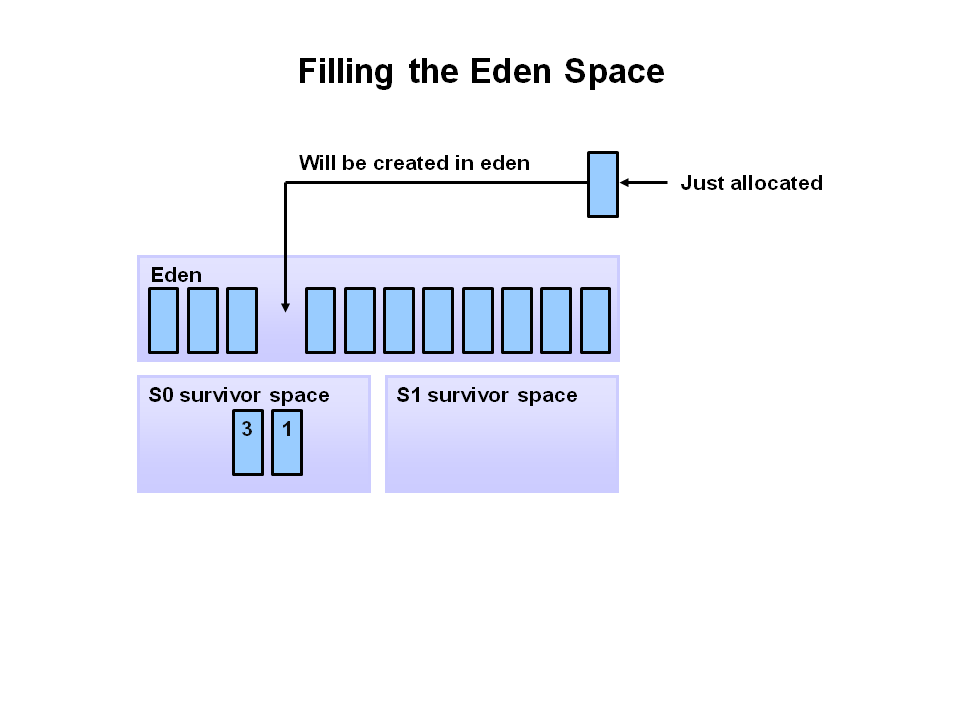
When the eden space fills up, a minor garbage collection is triggered.
Referenced objects are moved to the first survivor space. Unreferenced objects are deleted when the eden space is cleared.
At the next minor GC, the same thing happens for the eden space. Unreferenced objects are deleted and referenced objects are moved to a survivor space. However, in this case, they are moved to the second survivor space (S1). In addition, objects from the last minor GC on the first survivor space (S0) have their age incremented and get moved to S1. Once all surviving objects have been moved to S1, both S0 and eden are cleared. Notice we now have differently aged object in the survivor space.
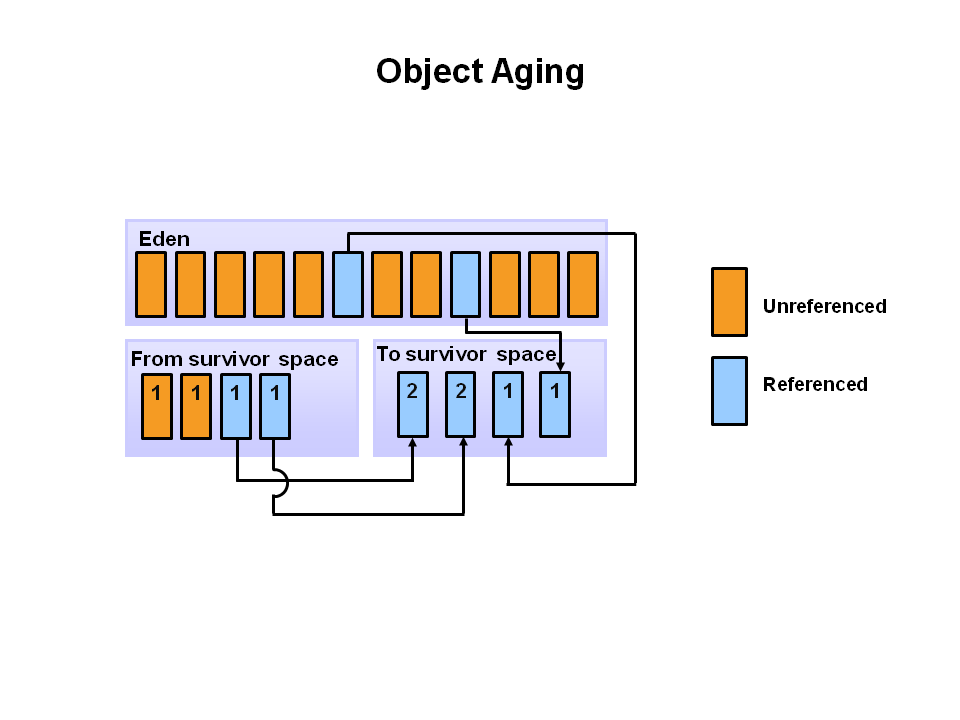
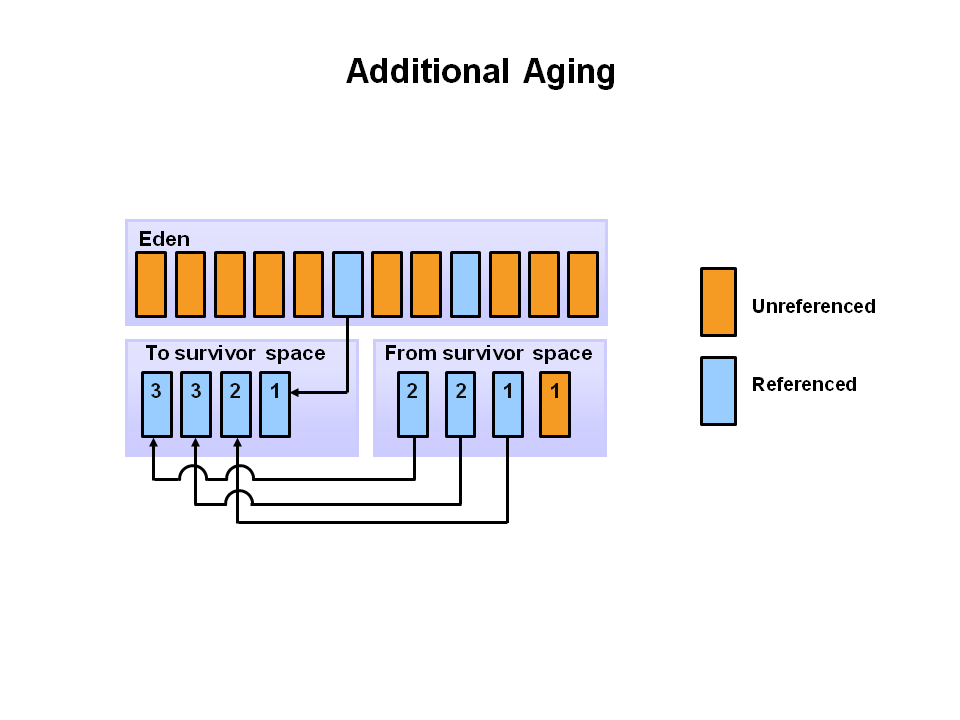
At the next minor GC, the same process repeats. However this time the survivor spaces switch. Referenced objects are moved to S0. Surviving objects are aged. Eden and S1 are cleared.
This slide demonstrates promotion. After a minor GC, when aged objects reach a certain age threshold (8 in this example) they are promoted from young generation to old generation.
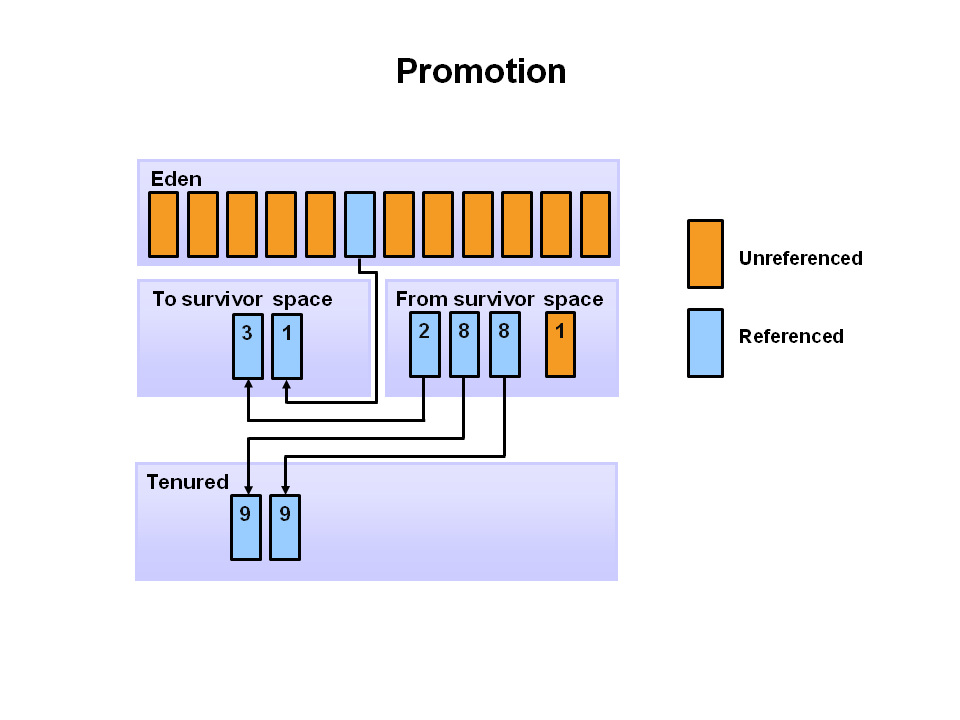
As minor GCs continue to occure objects will continue to be promoted to the old generation space.
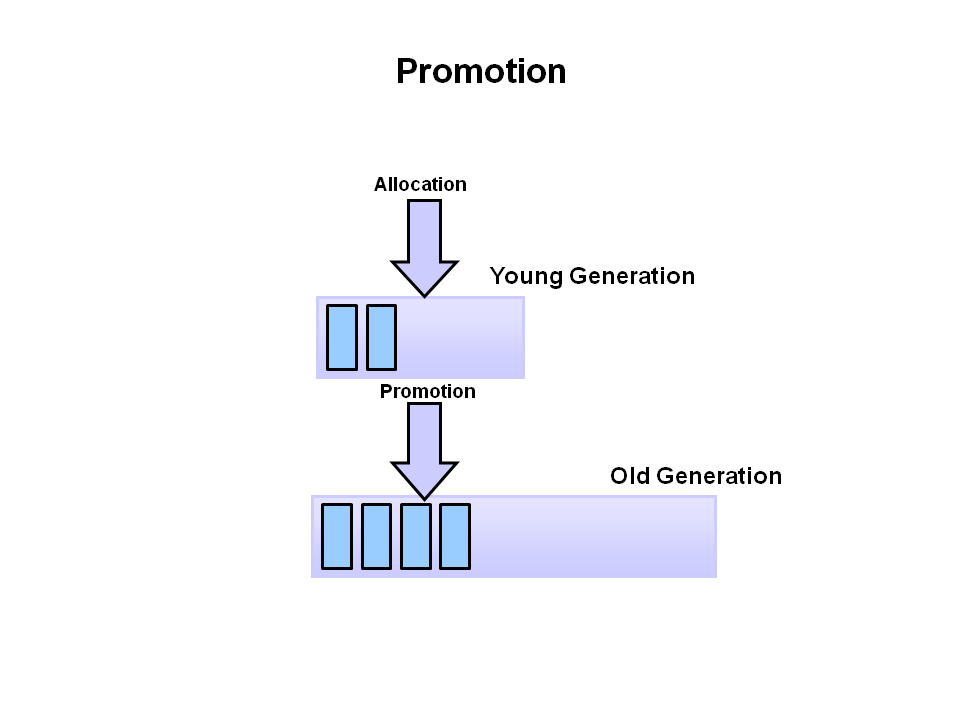
So that pretty much covers the entire process with the young generation. Eventually, a major GC will be performed on the old generation which cleans up and compacts that space.
Performing Your Own Observations
Overview
You have seen the garbage collection process using a series of pictures. Now it is time to experience and explore the process live. In this activity, you will run a Java application and analyze the garbage collection process using Visual VM. The Visual VM program is included with the JDK and allows developers to monitor various aspects of a running JVM.
Hands On Activities
Step 1: Initial Setup
The software required to do this activity is described at the beginning of this OBE. If you have not downloaded and installed the required software as described, do so now.
The software must be installed before you can continue.
Step 2: Start a Demo Application
With the Java JDK and demos installed, you can now run demo application that will be analyzed in this activity. For this example, the demos are installed in c:\javademos .
The demo application is a 2D graphics demo. To execute it type: java -Xmx12m -Xms3m -Xmn1m -XX:PermSize=20m -XX:MaxPermSize=20m -XX:+UseSerialGC -jar c:\javademos\demo\jfc\Java2D\Java2demo.jar
Note: The meaning of these switches are explained later in the OBE.
The Java 2D Demo should launch and look something like this:
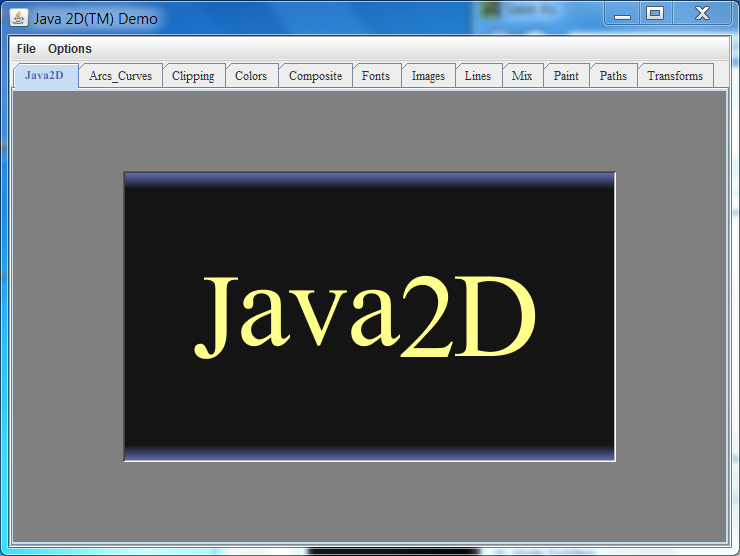
You can see a number of different tabs that demonstrate various Java graphics features.
Click on the Transforms tabs. You should see a new screen that looks like this:
![]()
This part of the application creates some nice garbage collection behavior that we can observe. Leave the application running, we will return to it shortly.
Step 3: Start VisualVM
To start Visual VM, use the jvisualvm executable in the C:\Program Files\Java\jdk1.7.0_XX\bin directory. I recommend that you add this directory to you path. On Windows 7 the steps would be: Start -> Computer -> System Properties -> Advanced System Settings -> Environment Variables. Then under System Variables select Path and add C:\Program Files\Java\jdk1.7.0_XX\bin; to the Path (where XX is the current version of the JDK). Click Ok several times and then close the dialog.
Once this is done, you should be able to open a Command Prompt windows and type jvisualvm .
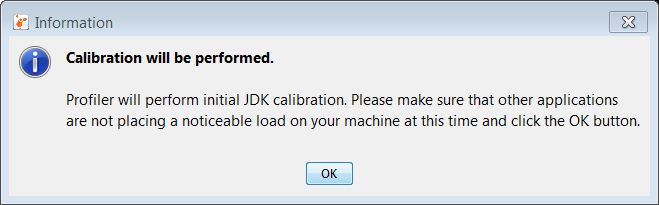
The first time Visual VM runs, it will do a calibration of your system. You will see messages like the following:
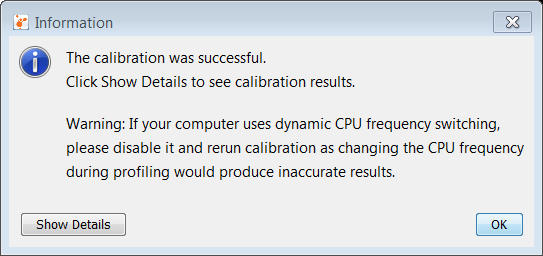
Then a message like this:
Finally the main user interface loads.
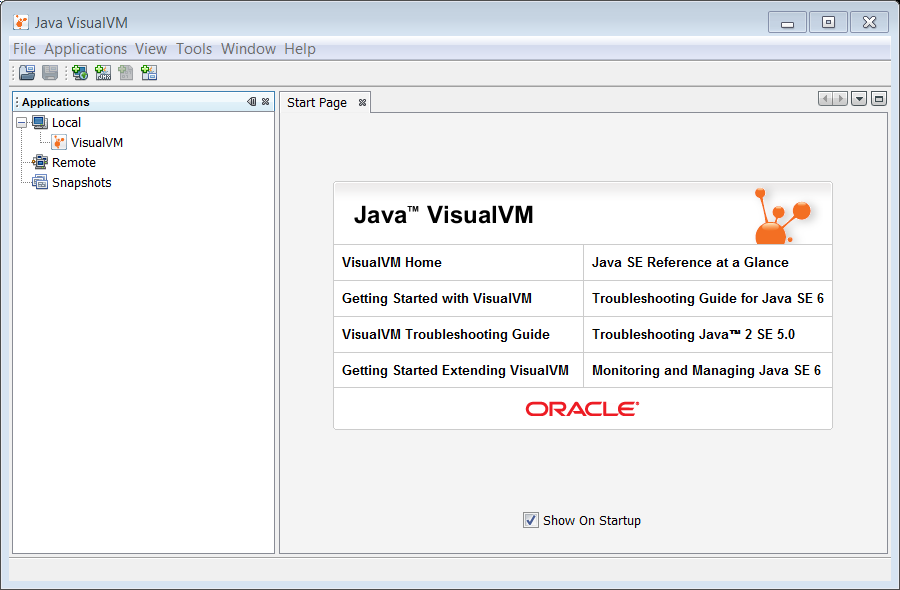
From here, we can monitor running JVMs. However, for this activty we need to add the VisualGC plugin.
Step 4: Install Visual GC
The Visual GC plugin for Visual VM provides a graphical representation of the garbage collectors activity in the JVM. It is free and can be added to your installation by following these steps.
To install Visual GC, from the menu select Tools —> Plugins. You should get the following dialog.
Select Visual GC and then select the Install button.
The plugin installer starts. Click Next.
Read and accept the license agreement. Click Install. The plugin will now be installed.
The plugin is now installed. Click Finish to complete the installation.
VisualGC is installed. Now we can examine the Java2Demo to see what sort of things are going on.
Step 5: Analyze the Java2Demo
Time to analyze the application we started in step 2.
First, right click the Java2Demo application in the Local applications list of the Applications tab. Select Open.
The application is loaded into Visual VM. Notice a number of tabs are loaded on the right side of the interface. Click the Visual GC tab.
The Visual GC tab shows all the activity going on in the Garbage Collector. You can watch as the Eden space is filled up and data is moved between the two survivor spaces S1 and S0. In addition, graphs and stats of related to the garbage collector are shown at the right.
Feel free to try the other tabs and see what information is presented about the JVM. In addition, you can try changing the number of strings or images shown in our sample application to see how that affects the garbage collection process.
Java Garbage Collectors
You now know the basics of garbage collection and have observed the garbage collector in action on a sample application. In this section, you will learn about the garbage collectors available for Java and the command line switches you need to select them.
Common Heap Related Switches
There are many different command line switches that can be used with Java. This section describes some of the more commonly used switches that are also used in this OBE.
| Switch | Description |
| -Xms | Sets the initial heap size for when the JVM starts. |
| -Xmx | Sets the maximum heap size. |
| -Xmn | Sets the size of the Young Generation. |
| -XX:PermSize | Sets the starting size of the Permanent Generation. |
| -XX:MaxPermSize | Sets the maximum size of the Permanent Generation |
The Serial GC
The serial collector is the default for client style machines in Java SE 5 and 6. With the serial collector, both minor and major garbage collections are done serially (using a single virtual CPU). In addition, it uses a mark-compact collection method. This method moves older memory to the beginning of the heap so that new memory allocations are made into a single continuous chunk of memory at the end of the heap. This compacting of memory makes it faster to allocate new chunks of memory to the heap.
Usage Cases
The Serial GC is the garbage collector of choice for most applications that do not have low pause time requirements and run on client-style machines. It takes advantage of only a single virtual processor for garbage collection work (therefore, its name). Still, on today’s hardware, the Serial GC can efficiently manage a lot of non-trivial applications with a few hundred MBs of Java heap, with relatively short worst-case pauses (around a couple of seconds for full garbage collections).
Another popular use for the Serial GC is in environments where a high number of JVMs are run on the same machine (in some cases, more JVMs than available processors!). In such environments when a JVM does a garbage collection it is better to use only one processor to minimize the interference on the remaining JVMs, even if the garbage collection might last longer. And the Serial GC fits this trade-off nicely.
Finally, with the proliferation of embedded hardware with minimal memory and few cores, the Serial GC could make a comeback.
Command Line Switches
To enable the Serial Collector use:
-XX:+UseSerialGC
Here is a sample command line for starting the Java2Demo :
java -Xmx12m -Xms3m -Xmn1m -XX:PermSize=20m -XX:MaxPermSize=20m -XX:+UseSerialGC -jar c:\javademos\demo\jfc\Java2D\Java2demo.jar
The Parallel GC
The parallel garbage collector uses multiple threads to perform the young genertion garbage collection. By default on a host with N CPUs, the parallel garbage collector uses N garbage collector threads in the collection. The number of garbage collector threads can be controlled with command-line options:
-XX:ParallelGCThreads=<desired number>
On a host with a single CPU the default garbage collector is used even if the parallel garbage collector has been requested. On a host with two CPUs the parallel garbage collector generally performs as well as the default garbage collector and a reduction in the young generationgarbage collector pause times can be expected on hosts with more than two CPUs. The Parallel GC comes in two flavors.
Usage Cases
The Parallel collector is also called a throughput collector. Since it can use multilple CPUs to speed up application throughput. This collector should be used when a lot of work need to be done and long pauses are acceptable. For example, batch processing like printing reports or bills or performing a large number of database queries.
-XX:+UseParallelGC
With this command line option you get a multi-thread young generation collector with a single-threaded old generation collector. The option also does single-threaded compaction of old generation.
Here is a sample command line for starting the Java2Demo :
java -Xmx12m -Xms3m -Xmn1m -XX:PermSize=20m -XX:MaxPermSize=20m -XX:+UseParallelGC -jar c:\javademos\demo\jfc\Java2D\Java2demo.jar
-XX:+UseParallelOldGC
With the -XX:+UseParallelOldGC option, the GC is both a multithreaded young generation collector and multithreaded old generation collector. It is also a multithreaded compacting collector. HotSpot does compaction only in the old generation. Young generation in HotSpot is considered a copy collector; therefore, there is no need for compaction.
Compacting describes the act of moving objects in a way that there are no holes between objects. After a garbage collection sweep, there may be holes left between live objects. Compacting moves objects so that there are no remaining holes. It is possible that a garbage collector be a non-compacting collector. Therefore, the difference between a parallel collector and a parallel compacting collector could be the latter compacts the space after a garbage collection sweep. The former would not.
Here is a sample command line for starting the Java2Demo :
java -Xmx12m -Xms3m -Xmn1m -XX:PermSize=20m -XX:MaxPermSize=20m -XX:+UseParallelOldGC -jar c:\javademos\demo\jfc\Java2D\Java2demo.jar
The Concurrent Mark Sweep (CMS) Collector
The Concurrent Mark Sweep (CMS) collector (also referred to as the concurrent low pause collector) collects the tenured generation. It attempts to minimize the pauses due to garbage collection by doing most of the garbage collection work concurrently with the application threads. Normally the concurrent low pause collector does not copy or compact the live objects. A garbage collection is done without moving the live objects. If fragmentation becomes a problem, allocate a larger heap.
Note: CMS collector on young generation uses the same algorithm as that of the parallel collector.
Usage Cases
The CMS collector should be used for applications that require low pause times and can share resources with the garbage collector. Examples include desktop UI application that respond to events, a webserver responding to a request or a database responding to queries.
Command Line Switches
To enable the CMS Collector use:
-XX:+UseConcMarkSweepGC
and to set the number of threads use:
-XX:ParallelCMSThreads=<n>
Here is a sample command line for starting the Java2Demo :
java -Xmx12m -Xms3m -Xmn1m -XX:PermSize=20m -XX:MaxPermSize=20m -XX:+UseConcMarkSweepGC -XX:ParallelCMSThreads=2 -jar c:\javademos\demo\jfc\Java2D\Java2demo.jar
The G1 Garbage Collector
The Garbage First or G1 garbage collector is available in Java 7 and is designed to be the long term replacement for the CMS collector. The G1 collector is a parallel, concurrent, and incrementally compacting low-pause garbage collector that has quite a different layout from the other garbage collectors described previously. However, detailed discussion is beyond the scope of this OBE.
Command Line Switches
To enable the G1 Collector use:
-XX:+UseG1GC
Here is a sample command line for starting the Java2Demo :
java -Xmx12m -Xms3m -XX:+UseG1GC -jar c:\javademos\demo\jfc\Java2D\Java2demo.jar
Summary
In this OBE, you have been given an overview of garbage collection system on the Java JVM. First you learned how the Heap and the Garbage Collector are key parts of any Java JVM. Automatic garbage collection is accomplished using generational garbage collection approach. Once you learned the process, you observed it using the Visual VM tool. Finally, you reviewed the garbage collectors that are available in the Java Hospot JVM.
In this tutorial, you have learned:
- The components of the Java JVM
- How automatic garbage collection works
- The generational garbage collection process
- How to monitor your JVM with Visual VM
- The types of garbage collectors available on the JVM
Resources
For more information and related information please see these site and links.
Credits
- Curriculum Developer: Michael J Williams
- QA: Krishnanjani Chitta
To help navigate this Oracle by Example, note the following: Hiding Header Buttons: Click the Title to hide the buttons in the header. To show the buttons again, simply click the Title again. Topic List Button: A list of all the topics. Click one of the topics to navigate to that section. Expand/Collapse All Topics: To show/hide all the detail for all the sections. By default, all topics are collapsed Show/Hide All Images: To show/hide all the screenshots. By default, all images are displayed. Print: To print the content. The content currently displayed or hidden will be printed.
To navigate to a particular section in this tutorial, select the topic from the list.
Избавляемся от мусора в Java

Для работы любого приложения требуется память. Однако память компьютера ограничена. Поэтому важно ее очищать от старых неиспользуемых данных, чтобы освободить место для новых.
Кто занимается этой очисткой? Как и когда очищается память? Как выглядит структура памяти? Давайте разберем с этим подробнее.
Структура памяти Java
Память в Java состоит из следующих областей:
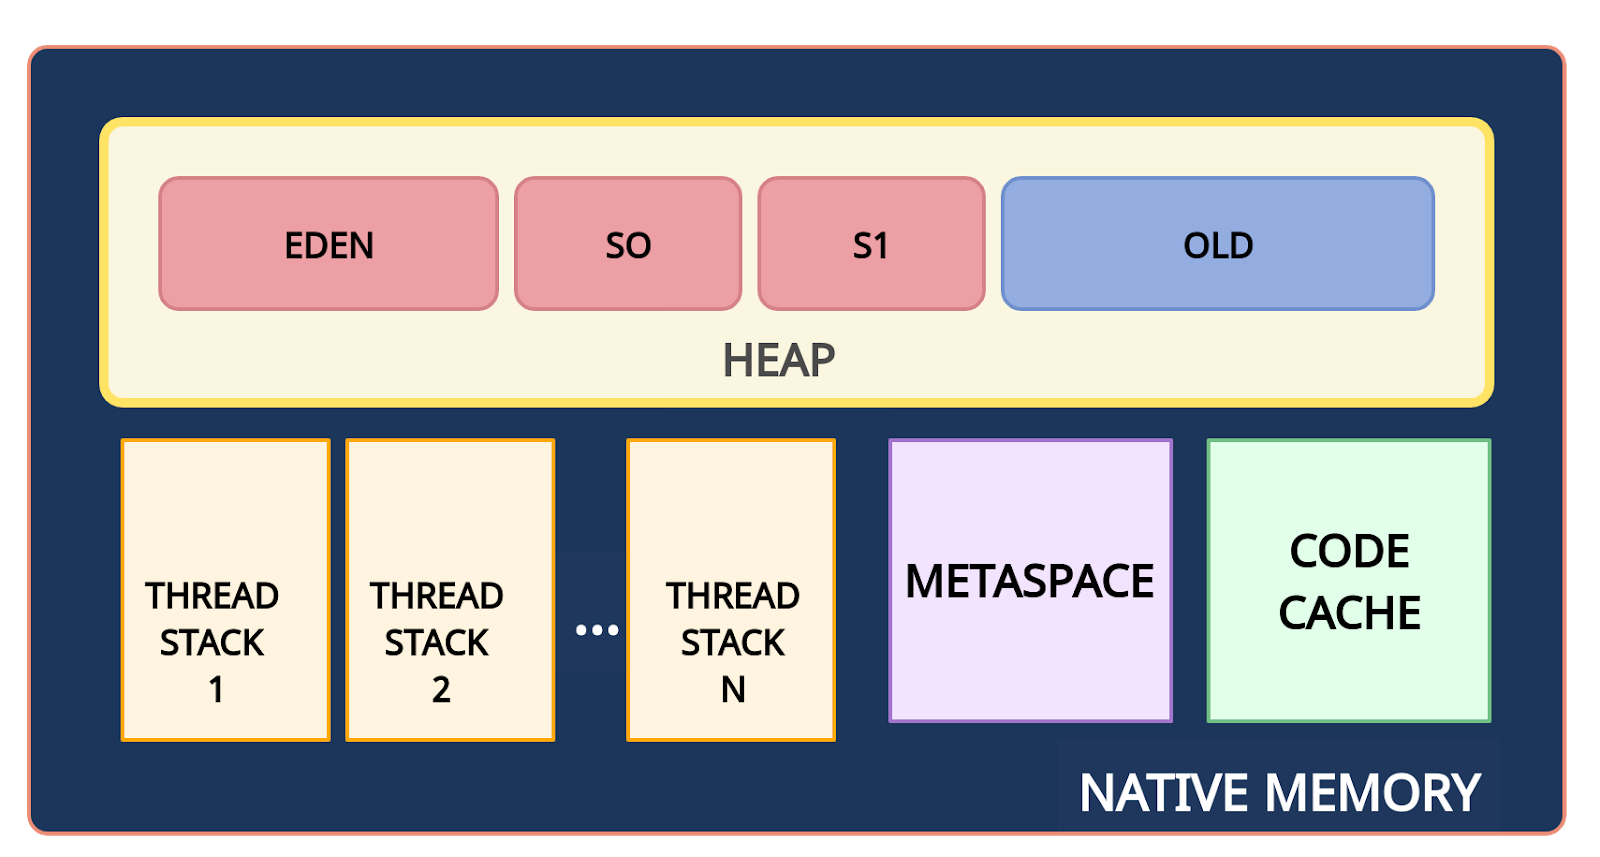
Структура памяти Java
Native Memory — вся доступная системная память.
Heap (куча) — часть native memory, выделенная для кучи. Здесь JVM хранит объекты. Это общее пространство для всех потоков приложения. Размер этой области памяти настраивается с помощью параметра -Xms (минимальный размер) и -Xmx (максимальный размер).
Stack (стек) — используется для хранения локальных переменных и стека вызовов метода. Для каждого потока выделяется свой стек.
Metaspace (метаданные) — в этой памяти хранятся метаданные классов и статические переменные. Это пространство также является общими для всех. Так как metaspace является частью native memory, то его размер зависит от платформы. Верхний предел объема памяти, используемой для metaspace, можно настроить с помощью флага MaxMetaspaceSize.
PermGen (Permanent Generation, постоянное поколение) присутствовало до Java 7. Начиная с Java 8 ему на смену пришла область Metaspace.
CodeCache (кэш кода) — JIT-компилятор компилирует часто исполняемый код, преобразует его в нативный машинный код и кеширует для более быстрого выполнения. Это тоже часть native memory.
Сборка мусора: введение
Что такое «мусор»? Мусором считается объект, который больше не может быть достигнут по ссылке из какого-либо объекта. Поскольку такие объекты больше не используются в приложении, то их можно удалить из памяти.
Например, на диаграмме ниже объект fruit2 может быть удален из памяти, поскольку на него нет ссылок.
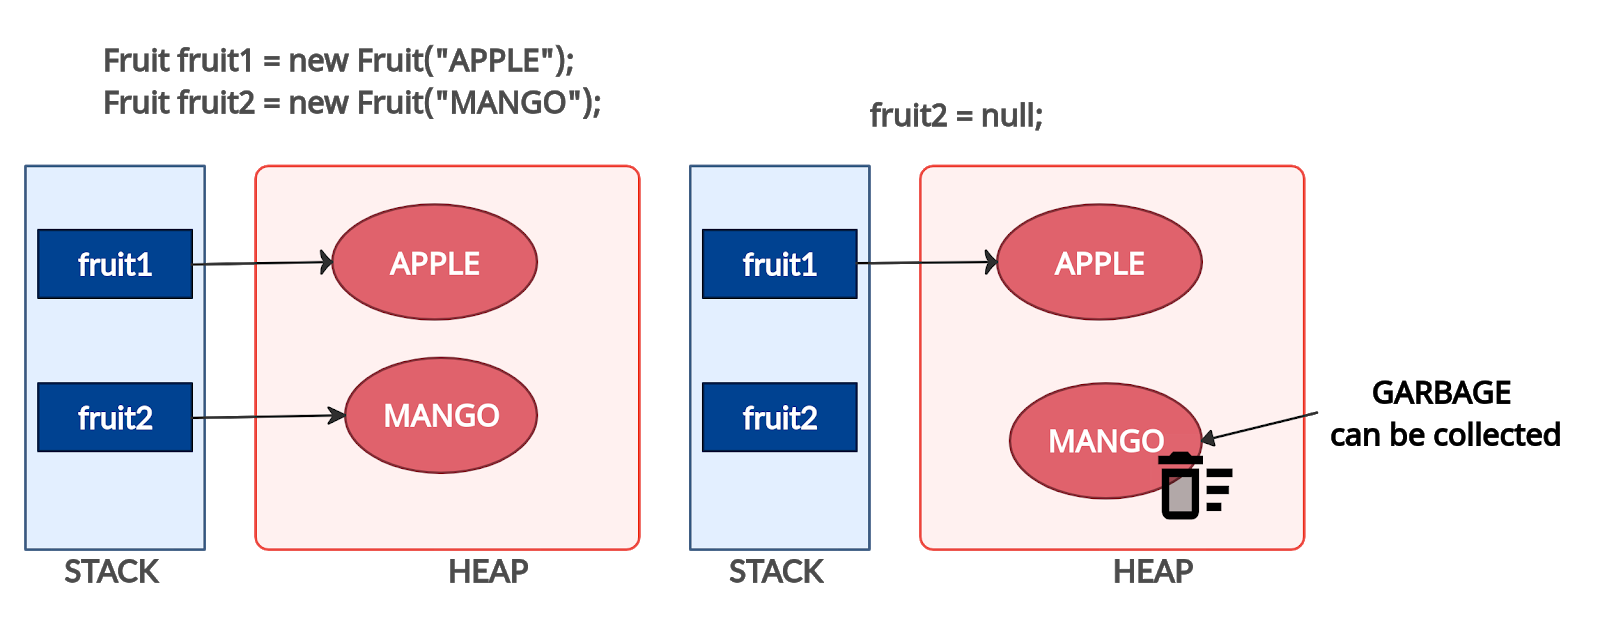
Мусор
Что такое сборка мусора? Сборка мусора — это процесс автоматического управления памятью. Освобождение памяти (путем очистки мусора) выполняется автоматически специальным компонентом JVM — сборщиком мусора (Garbage Collector, GC). Нам, как программистам, нет необходимости вмешиваться в процесс сборки мусора.
Источник: Oracle.com
Сборка мусора: процесс
Для сборки мусора используется алгоритм пометок (Mark & Sweep). Этот алгоритм состоит из трех этапов:
Mark (маркировка). На первом этапе GC сканирует все объекты и помечает живые (объекты, которые все еще используются). На этом шаге выполнение программы приостанавливается. Поэтому этот шаг также называется «Stop the World» .
Sweep (очистка). На этом шаге освобождается память, занятая объектами, не отмеченными на предыдущем шаге.
Compact (уплотнение). Объекты, пережившие очистку, перемещаются в единый непрерывный блок памяти. Это уменьшает фрагментацию кучи и позволяет проще и быстрее размещать новые объекты.
Поколения объектов
Что такое поколения объектов?
Для оптимизации сборки мусора память кучи дополнительно разделена на четыре области. В эти области объекты помещаются в зависимости от их возраста (как долго они используются в приложении).
Young Generation (молодое поколение). Здесь создаются новые объекты. Область young generation разделена на три части раздела: Eden (Эдем), S0 и S1 (Survivor Space — область для выживших).
Old Generation (старое поколение). Здесь хранятся давно живущие объекты.
Что такое Stop the World?
Когда запускается этап mark, работа приложения останавливается. После завершения mark приложение возобновляет свою работу. Любая сборка мусора — это «Stop the World».
Что такое гипотеза о поколениях?
Как уже упоминалось ранее, для оптимизации этапов mark и sweep используются поколения. Гипотеза о поколениях говорит о следующем:
Большинство объектов живут недолго.
Если объект выживает, то он, скорее всего, будет жить вечно.
Этапы mark и sweep занимают меньше времени при большом количестве мусора. То есть маркировка будет происходить быстрее, если анализируемая область небольшая и в ней много мертвых объектов.
Таким образом, алгоритм сборки мусора, использующий поколения, выглядит следующим образом:
Новые объекты создаются в области Eden. Области Survivor (S0, S1) на данный момент пустые.
Когда область Eden заполняется, происходит минорная сборка мусора (Minor GC). Minor GC — это процесс, при котором операции mark и sweep выполняются для young generation (молодого поколения).
После Minor GC живые объекты перемещаются в одну из областей Survivor (например, S0). Мертвые объекты полностью удаляются.
По мере работы приложения пространство Eden заполняется новыми объектами. При очередном Minor GC области young generation и S0 очищаются. На этот раз выжившие объекты перемещаются в область S1, и их возраст увеличивается (отметка о том, что они пережили сборку мусора).
При следующем Minor GC процесс повторяется. Однако на этот раз области Survivor меняются местами. Живые объекты перемещаются в S0 и у них увеличивается возраст. Области Eden и S1 очищаются.
Объекты между областями Survivor копируются определенное количество раз (пока не переживут определенное количество Minor GC) или пока там достаточно места. Затем эти объекты копируются в область Old.
Major GC. При Major GC этапы mark и sweep выполняются для Old Generation. Major GC работает медленнее по сравнению с Minor GC, поскольку старое поколение в основном состоит из живых объектов.
Преимущества использования поколений
Minor GC происходит в меньшей части кучи (
2/3 от кучи). Этап маркировки эффективен, потому что область небольшая и состоит в основном из мертвых объектов.
Недостатки использования поколений
В каждый момент времени одно из пространств Survivor (S0 или S1) пустое и не используется.
Сборка мусора: флаги
В этом разделе приведены некоторые важные флаги, которые можно использовать для настройки процесса сборки мусора.
Флаг
Описание
Первоначальный размер кучи
Максимальный размер куча
Отношение размера Old Generation к Young Generation
Отношение размера Eden к Survivor
Возраст объекта, когда объект перемещается из области Survivor в область Old Generation
Типы сборщиков мусора
Сборщик мусора
Описание
Преимущества
Когда использовать
Флаги для включения
Использует один поток.
Эффективный, т.к. нет накладных расходов на взаимодействие потоков.
Работа с небольшими наборами данных.
Использует несколько потоков.
Многопоточность ускоряет сборку мусора.
В приоритете пиковая производительность.
Допустимы паузы при GC в одну секунду и более.
Работа со средними и большими наборами данных.
Для приложений, работающих на многопроцессорном или многопоточном оборудовании.
Выполняет некоторую тяжелую работу параллельно с работой приложения.
Может использоваться как на небольших системах, так и на больших с большим количеством процессоров и большим количеством памяти.
Когда время отклика важнее пропускной способности.
Паузы GC должны быть меньше одной секунды.
Выполняет всю тяжелую работу параллельно с работой приложения.
В приоритете время отклика.
Сборщики мусора в Java
Инструменты мониторинга GC
Что мониторить?
Частота запуска сборки мусора. Так как GC вызывает «stop the world», поэтому чем время сборки мусора меньше, тем лучше.
Длительность одного цикла сборки мусора.
Как мониторить сборщик мусора?
Для мониторинга можно использовать следующие инструменты:
Для включения логирования событий сборщика мусора добавьте следующие параметры JVM: