JDB — Introduction
Debugging is a technical procedure to find and remove bugs or defects in a program and get expected results. Debugging includes testing and monitoring. It is very complex when the subunits of a program are tightly coupled. We can debug a program using the debugger tools that follow the prescribed APIs. A debugger allows you to step through every aspect of a code, inspect all the elements, and remove errors, if any.
Debugging Techniques
There are different kinds of techniques to debug a Java program. The old method of debugging is by using print statements at the end of every segment which will print the trace statements on the console. Take a look at the following code.
Here, we have a program that adds two numbers and prints the output. Notice that at each step, we have introduced a print statement that prints the state of the program on the console. This is the traditional approach to debug a program.
In addition, we have advanced concepts that can be used to debug a program such as:
- stepping
- breakpoints, and
- exceptions or watchpoints.
Types of Debugging
We can debug a program using various methods:
- Using Java bytecode (compiled version of Java code)
- Using comments inside the programs
- Attaching class to a running program
- Remote debugging
- Debugging on demand
- Optimized code debugging
Java Debuggers
Here are some examples of Java debuggers that are available in the market:
- IDEs such as Eclipse, Netbeans, etc. contain their own debuggers (Visual cafe, Borland, JBuilder)
- Standalone debugger GUIs (such as Jikes, Java platform debugger, and JProbe)
- Command-line debugger (Sun’s JDB)
- Notepad or VI driven (stack trace)
This tutorial covers how to use the command-line debugger, jdb.
The Java debugger (JDB) is a tool for Java classes to debug a program in command line. It implements the Java Platform Debugger Architecture. It helps in detecting and fixing bugs in a Java program using Java Debug Interface (JDI).
JDB in JDK
The following architecture defines the role of JDB in JDK. It contains mainly three units:
- Java Virtual Machine Tool Interface (JVM TI)
- Java Debug Wiring Pool (JDWP)
- Java Debugger Interface (JDI)
JVM TI
It is a native programming interface implemented by VM. It provides ways to inspect and debug the state of the application running on the VM. It allows an implementer (VM Implementer) that can be enclosed easily into the debugging architecture. It also uses a third-party channel called JDWP for communication.
It defines the format of information and the requests that pass in between the debuggee process and the debugger front end. The primary purpose of having a JDWP is to allow the debuggee and the debugger to communicate when they run under separate VMs or in separate platforms.
It is a high-level Java interface implemented as front end. It defines the variable information at user code level. It is recommended to use a JDI layer for all debugger development. It uses JDWP for communication with the debuggee JVM.
JDB — Installation
This chapter explains how to install JDB on Windows and Linux based systems. JDB is a part of JDK. Therefore, JDK installation is enough for using JDB in command prompt.
System Requirements
Here are the system requirements for installing JDB:
| JDK | Java SE 2 JDK 1.5 or above |
| Memory | 1 GB RAM (recommended) |
| Disk Space | No minimum requirement |
| Operating System Version | Windows XP or above, Linux |
Follow the simple steps given below to install JDB on your system.
Step 1: Verifying Java Installation
First of all, you need to have Java Software Development Kit (SDK) installed on your system. To verify this, execute any of the two commands depending on the platform you are working on.
If the Java installation has been done properly, then it displays the current version and specifications of Java installation. A sample output is given in the following table.
Open command console and type:
\>java –version
Java version «1.7.0_60»
Java (TM) SE Run Time Environment (build 1.7.0_60-b19)
Java Hotspot (TM) 64-bit Server VM (build 24.60-b09,mixed mode)
Open command terminal and type:
$java –version
java version «1.7.0_25»
Open JDK Runtime Environment (rhel-2.3.10.4.el6_4-x86_64)
Open JDK 64-Bit Server VM (build 23.7-b01, mixed mode)
We assume the readers of this tutorial have Java SDK version 1.7.0_60 installed on their system. In case you do not have Java SDK, download its current version from the link http://www.oracle.com/technetwork/java/javase/downloads/index.html and install it.
Step 2: Setting Up Java Environment
Set the environment variable JAVA_HOME to point to the base directory location where Java is installed on your machine. For example,
| Platform | Description |
|---|---|
| Windows | set JAVA_HOME to C:\ProgramFiles\java\jdk1.7.0_60 |
| Linux | export JAVA_HOME=/usr/local/java |
Append the full path of Java compiler location to the System Path.
| Platform | Description |
|---|---|
| Windows | Append the String «C:\Program Files\Java\jdk1.7.0_60\bin» at the end of the system variable PATH. |
| Linux | export PATH=$PATH:$JAVA_HOME/bin/ |
Execute the command java -version from the command prompt as explained above.
Step 3: Verifying JDB Installation
Verify the JDB version as follows:
Open command console and type:
\>jdb –version
Open command terminal and type:
$jdb –version
JDB — Syntax
This chapter explains the syntax of JDB command. The syntax contains four sections listed as follows:
- JDB
- option
- class
- arguments
Syntax
The syntax of JDB is as follows.
It calls jdb.exe from the Java Development Kit.
Options
These include the command line options used to debug a Java program in an efficient way. The JDB launcher accepts all the options (such as -D, -classpath, and -X) and some additional advanced options such as (-attach, -listen, -launch, etc.).
Class
It is the class name on which you want to perform debugging operations.
Arguments
These are the input values given to a program at runtime. For example, arg[0], arg[1] to the main() method.
In the above four segments, options is the most important one.
JDB — Options
This chapter describes the important options available in JDB that are submitted as arguments with the jdb command.
Options
The following table contains a list of options accepted by JDB:
| Name | Description |
|---|---|
| -help | Displays the help message and lists the related options. |
| -sourcepath | Uses the given path for source files if path is not specified, then it takes the default path “.”, i.e., the current directory. |
| -attach | Attaches the debugger to the running VM by specifying the running VM address. |
| -listen | Waits for the running VM to connect using standard connector. |
| -listenany | Waits for the running VM to connect using any address. |
| -launch | Launches the debugged application immediately up on startup job. |
| -listconnectors | Lists the connectors available in this VM. |
| -connect | Connects to the target VM using named connector with listed argument values. |
| -dbgtrace | Prints information for debugging jdb. |
| -tclient | Runs the application in Java Hotspot VM (client). |
| -tserver | Runs the application in Java Hotspot VM (server). |
| -Joption | Passes the option to the Java virtual machine used to run JDB. |
Using Options with Commands
The following commands show how to use some of the above options:
The following command gets -help on using JDB.
-attach
The following command attaches the debugger to a specified VM (port number:1099).
-listen
The following command makes the JDB process running on the current VM wait using standard connector (VM in 8008).
-listenany
The following command makes the JDB process running on the current VM wait using any connector (VM in currently running port).
-tclient
The following command executes the application in Java Hotspot(™) VM(client).
-tserver
The following command executes the application in Java Hotspot(™) VM(server).
JDB — Session
This chapter describes how to start a JDB session in different ways. JDB launch is the frequently used technique to start a JDB session.
There are two different ways to start a JDB session:
- Starting JDB session by adding class (main class name) to it.
- Adding JDB to running JVM to start session.
Start a Session by Adding Class
The following command starts a JDB session:
Syntax
Example
Let us assume we have a class named TestClass. The following command starts a JDB session from the TestClass.
If you follow this command, it starts a new Java VM with any specified parameters. Thereafter it loads the class and stops it before executing the first statement of the class.
Start a Session by Adding JDB to a Running JVM
Given below is the syntax and example to start a JDB session by adding the JDB to a running JVM.
Syntax
The following syntax is for JDB session:
Example
Let us assume the main class name is TestClass and JVM allows the JDB to connect it later. The following is the command to add JDB to JVM:
Now you can attach the JDB to the JVM with the following command:
Note: Here, the TestClass is not added to the JDB command, because JDB is connected to the running VM instead of launching a new one.
JDB — Basic Commands
This chapter takes you through the basic commands of JDB. After launching a session, these commands are used for debugging a program.
The following is the list of commands used for debugging.
| Name | Description |
|---|---|
| help or ? | The most important JDB command; it displays a list of recognized commands with a brief description. |
| run | After starting JDB and setting the necessary breakpoints, you can use this command to start execution and debug an application. |
| cont | Continues execution of the debugged application after a breakpoint, exception, or step. |
| Displays Java objects and primitive values. | |
| dump | For primitive values, this command is identical to print. For objects, it prints the current value of each field defined in the object. Static and instance fields are included. |
| threads | Lists the threads that are currently running. |
| thread | Selects a thread to be the current thread. |
| where | Dumps the stack of the current thread. |
Example
Let us assume we have a sample class called Add for the following examples:
Add.java
Compile this class Add.java using the following command:
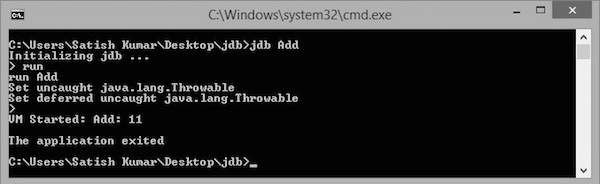
This command executes the main class file, which is added to JDB for debugging. Execute the following commands to run the Add class.
On executing these commands, you get to see the following output:
JDB — Breakpoints
This chapter explains the concept of breakpoints and how to set breakpoints in a program. A breakpoint introduces an explicit stop or pause in the execution of a program at a particular line of code while debugging. It is useful to acquire knowledge about variables in the program in its execution.
Syntax
The following command sets up a breakpoint at a particular line number:
The following command sets up a breakpoint on a particular method or on a particular variable:
Example
The following example shows how to set up a breakpoint in a class.
Save the above file as Add.java. Compile this file using the following command:
Debugging
Let us take an example for debugging. Here, we start the debugging process by setting up a breakpoint on main(). Given below are the steps to be followed in the debugging process:
Step 1: Start a JDB Session
The following command starts a JDB session on the Add class for debugging:
Step 2: Set a Breakpoint
The following command sets up a breakpoint on the main() method of Add class.
If the breakpoint is set successfully, you get to see the following output:
Step 3: Start Debugging
The following command starts execution of the class Add:
If you run this command, you get to see the following output. In this output, you find that the execution stops at the breakpoint position, that is at the main() function.
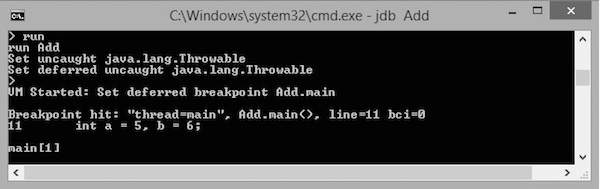
The execution stops at the first line of the main method, that is at «int a=5, b=6;» or Line no: 11 in the code. You can observe this information in the output.
Step 4: Continue Execution
The following command continues the program execution:
It gives you the remaining execution part and output as follows:
JDB — Stepping
This chapter explains how to use the concept of Stepping in debugging a program. Stepping is the debugger feature that lets you execute the code by stepping through line by line. Using this, you can examine each line of the code to ensure they are behaving as intended.
The following commands are used in the stepping process:
- step: steps to the next line of execution
- list: examines where you are in the code
- cont: continues the remaining execution
Example
The following example uses the Add class that we have used in the previous chapter:
Save the above file as Add.java. Compile this file using the following command:
Let us assume that the breakpoint is set on the main() method of the Add class. The following steps show how to apply stepping in the Add class.
Step 1: Execute the Job
The following command starts executing the class named Add.
If you execute this command, you get to see the following output. In this output, you can find that the execution stops at the breakpoint position, i.e., at the main() method.
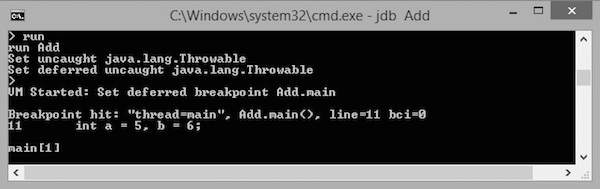
The execution stops at the first line of the main method, that is at «int a=5, b=6;» or Line no: 11 in the code. You can observe this information in the output.
Step 2: Step through the Code
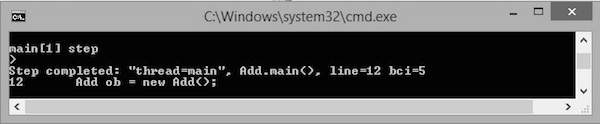
The following command steps the execution to the next line.
Now the execution steps to Line no: 12. You get to see the following output.
Step 3: List the Code
The following command lists the code:
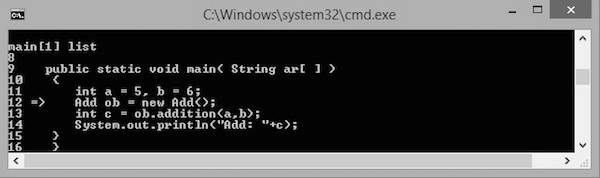
You get the following output. List command is used to let you know the line in the code up to which the program control has reached. Notice the arrow mark => in the following screenshot that shows the current position of the program control.
Step 4: Continue Execution
The following command continues to execute the code:
This command continues executing the remaining lines of the code. The output is as shown below:
Generally, there are three types of stepping:
- Step Into
- Step Over
- Step Out
Step Into
Using this command, you can step to the next line of the code. If the next line of the code is a function call, then it enters the function by driving the control at the top line of the function.
In the following code, the arrow mark defines the controller in the code.
If you use the step into command, the controller moves to the next line, i.e., «int c = ob.addition(a,b);». At this line, there is a function call addition(int, int) hence the controller moves to the topmost line of the addition function with the arrow mark as shown below:
Step Over
Step Over also executes the next line. But if the next line is a function call, it executes that function in the background and returns the result.
Let us take an example. In the following code, the arrow mark defines the control in the code.
If you use the step over command, the control moves to the next line, i.e., «int c = ob.addition(a,b);». In this line, there is a function call addition(int, int) hence the function execution is done in the background and the result is returned to the current line with the arrow mark as shown below:
Step Out
Step Out executes the next line. If the next line is a function call, it skips that and the function execution continues with the remaining lines of the code.
Let us take an example. In the following code, the arrow mark defines the controller in the code.
If you use the step out command, the controller moves to the next line, i.e., «int c = ob.addition(a,b);». In this line, there is a function call addition(int, int) hence the function execution is skipped and the remaining execution continues with the arrow mark as shown below:
JDB — Exception
This chapter explains how to handle the exception class using JDB. Generally, whenever a program raises an exception without a catch statement, then the VM prints the exception line, the cause of the exception, and exits. If the exception has been raised with a catch statement, then the exception is handled by the catch statement. Here, the VM prints the output with the cause of exception.
When the class that raises the exception is running under JDB, it also throws the uncaught exception. That exception can be handled using the catch command.
Example
Let us take an example of the class JdbException:
Save the above file with the name JdbException.java. Compile this file using the following command:
Follow the steps given below to handle the exception.
Step 1: Run the Class
The following command executes the class named JdbException as follows:
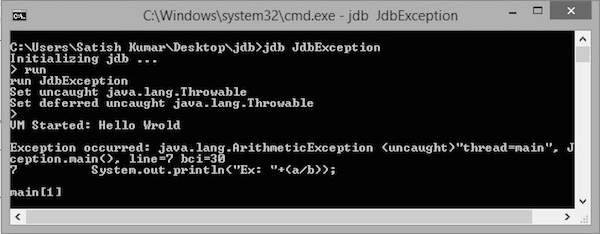
This JdbException class contains an exception, hence you get to see the following output:
Step 2: Catch the Exception
The following command catches the exception:
It will give you the following output:
Step 3: Continue Execution
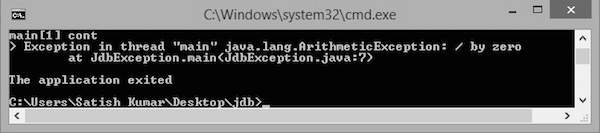
The following command continues the execution. Now the catch handles the arithmetic exception as follows:
JDB — In Eclipse
This chapter explains how to use JDB in Eclipse. Before proceeding further, you need to install Eclipse Indigo. Follow the steps given below to install Eclipse Indigo on your system.
Step 1: Download and Install Eclipse
Step 2: Create a New Project and a New Class
- Create a new Java project by following the options File-> New -> Java project.
- Name it as “sampledebug”.
- Create a new class by right clicking on the samplebebug project.
- Select options ->new -> class
- Name it as “Add.java”
Add.java
Step 3: Open the Debug Perspective
Follow the instructions given below to open the debug perspective.
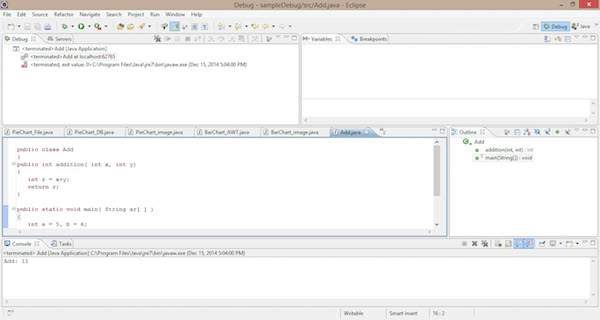
On the Eclipse IDE, go to Window -> Open perspective -> Debug. Now you get the debug perspective for the program Add.java. You get to see the following window.
Sections in Debug Perspective
The sections in the Debug perspective are as follows:
Coding Section
Java code is displayed in this section. It is the code you want to debug, that is, Add.java. Here we can add a breakpoint on a line by double clicking in front of the line. You find the blue bubble with an arrow symbol to point out the breakpoint of that line. See the following screenshot; you can find the selected area with a red circle pointed as “1”.
- Double click here. You can set the breakpoint for this line.
Breakpoint Section
This section defines the list of breakpoints that are set to the program code. Here we can add, delete, find, and manage the breakpoints. The following screenshot shows the breakpoint section.
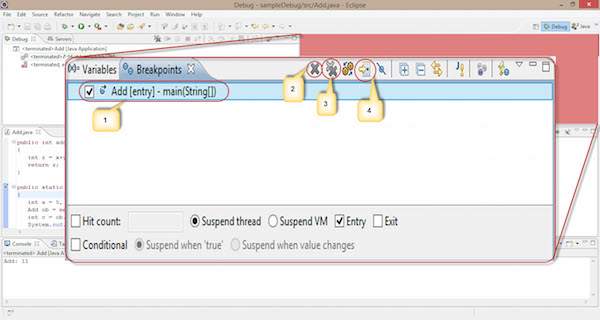
Observe the following options in the given screenshot:
Using the check box in the left, we can select or deselect a breakpoint. Here, we use one breakpoint, i.e., Add class-main() method.
The single cross icon “X” is used to delete the selected breakpoint.
The double cross icon “XX” is used to delete all the breakpoints in your code.
The arrow pointer is used to point to the code where the selected breakpoint is applied.
The remaining functionalities in the breakpoint section are as follows:
Hitcount : It shows how many times the control hits this breakpoint. It is used for recursive logic.
Suspend thread : We can suspend the current thread by selecting it.
Suspend VM : We can suspend the VM by selecting it.
Debug Section
This section is used for the process of debugging. It contains options that are used in debugging.
Start debugging : Follow the instructions given below to start debugging.
Right click on the code -> click Debug as -> click 1 Java application.
The process of debugging starts as shown in the following screenshot. It contains some selected options, highlighted using numeric digits.
We apply a breakpoint on the Add class main() method. When we start debugging, the controller gets stuck at the first line of the main() method.
It is used to Resume the debugging process and skip the current breakpoint. It works similar to the cont command in the JDB command line.
It is used to stop the debugging process.
It works similar to the step in process in the JDB command line. It is used for moving the control to the next line, i.e., point “1” moves to the next line.
It works similar to the step over process in the JDB command line.
It is used to see on which line the breakpoint is applied.
Follow the given steps and sections to debug your code in eclipse IDE. By default, every IDE contains this debugging process.
Debugging (отладка) в Java
Debugging в переводе с английского означает «Отладка». Она необходима в программировании Java, чтоб отслеживать логические ошибки в коде. И инструменты NetBeans позволяют это сделать.
Логические ошибки — это ошибки программиста, когда код работает не так, как вы ожидали. Их может быть трудно отследить. К счастью, в NetBeans есть несколько встроенных инструментов, которые помогут вам найти решение этой проблемы.
Для начала изучите этот код:
Введите этот код либо в проект, который у вас уже есть, либо запустив новый. В этом коде мы пытаемся подсчитать, сколько раз встречается буква «g» в слове «Debugging». Ответ очевиден 3. Однако, когда вы запускаете программу, в окне «Вывод» выведется:
Итак, мы сделали где-то в нашем коде ошибку. Но где? Java-программа выполняется нормально и не выдает никаких исключений для изучения в окне вывода. Так что делать?
Чтобы отследить проблемы с вашим кодом, NetBeans позволяет вам добавить нечто, называемое точкой остановки (Breakpoint).
Чтоб добавить новую точку остановки, нажмите в поле нумерации строк в NetBeans окна кода напротив той строки, которую хотите проверить:
В меню NetBeans выберите Debug > Debug Имя Вашего Проекта:
NetBeans перейдет к точке остановки и строка станет зеленого цвета. Сейчас он остановил выполнение кода. Также вы должны увидеть новую панель инструментов:
Первые три кнопки позволяют остановить сеанс debugging, приостановить и продолжить. Следующие три кнопки позволяют перейти по коду для debugging, дальше четвертая — выйти и последняя — перейти к курсору.
Вы можете нажать клавишу F5 и продолжить. Код должен работать как обычно с точкой остановки. Сеанс debugging завершится.
Когда сеанс debugging завершится, нажмите на точку остановки, чтобы избавиться от нее. Теперь добавьте точку остановки в цикл for:
Теперь нажмите Debug > New Watch. Watch позволяет отслеживать, что находится в переменной. Введите букву i в диалоговом окне Watch и нажмите OK:
Добавьте еще один Watch и введите single_letter. Нажмите ОК. Добавьте третий Watch и введите LetterCount. Вы должны увидеть эти три переменные внизу экрана:
Теперь нажмите значок Step Into на панели инструментов:
Или просто нажмите клавишу F7 на клавиатуре. Продолжайте нажимать F7 и наблюдайте, что происходит в окне Watch.
Вы обнаружите, что переменная i каждый раз увеличивается на 1. Но две остальные переменные остаются прежними:
Поскольку в переменной single_letter ничего нет, то LetterCount не может выходить за пределы нуля. Итак, мы нашли нашу проблему — использование substring является неправильным, так как оно не захватывает символы, указанные в круглых скобках.
Остановите сеанс debugging и измените строку с substring следующим образом:
Теперь снова запустите сеанс debugging. Продолжайте нажимать клавишу F7, чтобы пройти по каждой строке цикла for. На этот раз вы должны увидеть изменения переменных sinle_letter и LetterCount.
Запустите Java-программу, и вы увидите в окне «Вывод»:
Теперь у нас правильный ответ.
То есть, если ваш код работает не так, как планировалось, попробуйте установить точку остановки и несколько Watches для своих переменных. И начните сеанс debugging.
В следующем разделе мы рассмотрим совсем другую тему: как открывать текстовые файлы в Java.
Отладка Java-приложений из командной строки
Некоторые ошибки трудно воспроизвести на вашем персональном компьютере, но их легко воспроизвести на производственных или тестовых машинах. Это обычная ситуация, с которой часто сталкиваются профессиональные Java-разработчики. Для отладки таких проблем OpenJDK предоставляет два инструмента: remote debugging и jdb . Эта статья посвящена jdb .
Для приложений Java типичными производственными и тестовыми машинами являются серверы Linux без графического интерфейса, поэтому доступны только инструменты командной строки. И мы не можем использовать профессиональные IDE, такие как IntelliJ IDEA, Eclipse или Apache NetBeans IDE.
В таких сценариях мы можем использовать jdb . jdb — это отладчик командной строки, входящий в состав OpenJDK.
Это перевод руководства для начинающих. Очевидно эксперты все это знают и им не стоит тратит время на его чтение.
Отладка Java с помощью утилиты «jdb»
jdb расположена в каталоге jdk/bin. Она использует интерфейс отладки Java (JDI) для запуска и подключения к целевой JVM. Интерфейс отладки Java (JDI) предоставляет интерфейс языка программирования Java для отладки приложений на языке программирования Java. JDI является частью архитектуры отладчика платформы Java (Java Platform Debugger Architecture).
В этом разделе мы рассмотрим, как подключить jdb к java-приложению и начать отладку и мониторинг.
Команда jdb
Формат команды jdb:
Пример Java приложения для отладки
Ниже приведен пример Java класса, который мы собираемся отладить и попытаться понять различные доступные функции. Важно скомпилировать этот класс с параметром «-g» (javac -g Test.java), который генерирует всю отладочную информацию, включая локальные переменные. По умолчанию генерируется только информация о номере строки и исходном файле.
Подключение jdb к java-приложению
Приведенная ниже команда — это наиболее распространенный способ запуска приложения с отладчиком jdb. Здесь мы не передаем никаких параметров jdb, мы передали только имя класса, который не требует никаких аргументов:
Таким образом, мы запускаем выполнение основного класса «Test» аналогично тому, как мы запускаем выполнение основного класс в среде IDE. jdb останавливает JVM перед выполнением первой инструкции этого класса.
Другой способ использовать команду jdb для подключения ее к уже запущенной JVM. Синтаксис для запуска JVM с портом отладчика:
Чтобы подключить jdb к этому удаленному jvm, используйте синтаксис ниже:
В этой статье мы не будем подробно рассматривать удаленную отладку.
Отладка и мониторинг
Ниже приводится команда для присоединения jdb к Java-программе Test:
Установите точку останова в строке 5, используя команду «stop», как показано ниже:
Запустите выполнение основного класса приложения с помощью команды «run»:
Выполнить текущую строку с помощью команды «step»:
Выполнить текущую строку с помощью команды «step»:
Печать локальной переменной i с помощью команды «print»:
Печать всех локальных переменных в текущем фрейме стека с использованием команды «locals»:
Выгрузите стек потока, используя команду «where»:
Выдать список потоков в запущенном приложении, используя команду «threads»:
Продолжить выполнение с точки останова, используя команду cont :
Все доступные команды jdb можно получить используя команду «help»:
Поддерживается весьма стандартный синтаксис команд.
Команды запуска могут быть помещены в файлы «jdb.ini» или «.jdbrc» в каталогах user.home или user.dir.
Заключение
OpenJDK предоставляет множество замечательных инструментов для устранения неполадок и диагностики Java-приложений. Эти инструменты помогут вам быстро исправить проблемы в рабочем приложении. jdb может быть большим подспорьем, когда нет другого способа, кроме отладки приложения, а ваша любимая IDE недоступна. Знание таких функций поможет вам улучшить задание Java.
Чтобы помочь вам, автор статьи написал электронную книгу 5 steps to Best Java Jobs. Вы можете загрузить это пошаговое руководство бесплатно!
Debug в Intellij IDEA: гайд для новичков

Всем привет, JavaRush сообщество. Сегодня поговорим о дебаге: что это такое и как дебажить в Intellij IDEA. Статья рассчитана на людей, у которых есть уже минимальные знания Java Core. Здесь не будет ни фреймворков, ни сложных процессов публикации библиотек. Легкая прогулка. Так что располагайтесь поудобнее — начнем!
Почему Debug тебе необходим

Давайте сразу проясним для себя: кода без багов не бывает… Так устроена жизнь. Поэтому не стоит сразу раскисать и бросать все, если код работает не так, как мы ожидали. Но что же делать? Конечно, можно наставить System.out.println везде, где только можно и потом разгребать вывод в терминале в надежде на то, что получится найти ошибку. Все-таки можно… и это делают, и делают аккуратно при помощи логирования (можно почитать об этом здесь). Но если есть возможность запустить на локальной машине код, лучше использовать Debug . Сразу хочу заметить, что в этой статье мы будем рассматривать дебаг проекта внутри Intellij IDEA. Если интересно почитать об удаленном дебаге — вот, пожалуйста, статья из нашего ресурса.
Что такое Debug

Debug — это процесс отладки (проверки) кода, когда в процессе его выполнения можно остановиться в обозначенном месте и посмотреть за ходом выполнения. Понять, в каком состоянии находится программа в определенном месте. Это точно так же, как если бы можно было остановить жизнь и посмотреть на всё со стороны. Круто, правда? Наша задача состоит в том, чтобы быстро и просто научиться проводить отладку приложений при помощи всеми нами любимой среды разработки Intellij IDEA.
Что нужно для начала отладки
- Среда разработки Intellij IDEA версии 2019.3.1 и выше. На случай, если у кого-то её нет, вот ссылка, где можно скачать. Скачивайте Community Edition, так как я буду использовать именно ее.
- Клонировать проект из GitHub и импортировать его через IDEA.
Немного теории… обещаю 😀

если в выражении есть лямбда, то IDEA предлагает вам выбор — поставить на всю линию или конкретно в лямбда выражение: