Как быстро протестировать скорость загрузки сайта и оптимизировать ее?
По статистике Google, если сайт загружается дольше 3-х секунд, 53% пользователей покидают его. Каждая следующая секунда задержки загрузки сокращает конверсию в среднем на 20%.
Опрос Unbounce, в котором участвовали сотни покупателей и маркетологов, показал, что около 70% респондентов с меньшей вероятностью совершат покупку на сайте, если время его загрузки оказалось дольше, чем ожидалось. Поэтому компаниям необходимо следить не только за ростом трафика, но и за тем, как посетители взаимодействуют с сайтом, т.к. скорость загрузки страниц влияет как на конверсию, повышение позиции в поисковиках и снижение процента отказов, так и другие важные для бизнеса KPI: количество MQL и SQL, LTV, ROI.
Что сейчас в тренде?
В прошлом году Google выпустил несколько новых обновлений своих поисковых алгоритмов. Согласно аналитике американской корпорации, в приоритете сейчас скорость работы сайта, качество предлагаемого контента, но основная ставка делается на удобство страниц.
Тренд на юзабилити сайта появился еще пол года назад – в середине 2021 года – факторы ранжирования, отражающие удобство страниц, стали использоваться в мобильном поиске. С февраля 2022 г. удобство страниц будет учитываться при ранжировании результатов поиска и на ПК. Алгоритмы готовы, поэтому изменения вступят в полную силу уже до конца марта 2022 г. Во внимание будут приниматься данные об удобстве страниц для мобильных устройств, используемые с августа 2021 г.
Под удобством страницы понимается набор признаков, определяющих, насколько пользователям просто и комфортно взаимодействовать с ней. Информационная ценность страницы при этом учитывается, но не является определяющей для поисковых систем, особенно когда сайт многостраничный. Юзабилити сайта на сегодняшний день имеет гораздо большее значение. Удобство оценивается по основным интернет-показателям, таким как скорость загрузки, интерактивность и визуальная стабильность. Кроме того, учитываются и другие сигналы: оптимизация для мобильных устройств, использование HTTPS и соблюдение правил в отношении назойливых межстраничных объявлений.
Показатели, отражающие удобство страницы:
- Основные интернет-показатели:
— Отрисовка самого крупного контента ( Largest Contentful Paint, LCP). Этот параметр показывает скорость загрузки основного контента. Чтобы страницей было удобно пользоваться, показатель должен составлять менее 2,5 с с начала скачивания страницы.
— Задержка после первого ввода (First Input Delay, FID). Это значение подразумевает интерактивность – время ожидания до первого взаимодействия с контентом. И оно должно составлять менее 100 мс.
— Совокупное смещение макета (Cumulative Layout Shift, CLS) свидетельствует о стабильности верстки и элементов, не препятствующих взаимодействию с контентом. Значение CLS должно быть менее 0,1.
- Использование сайта на мобильных устройствах. Ваш ресурс должен быть оптимизирован и адаптирован под мобильные устройства.
- HTTPS. Страница должна поддерживать протокол HTTPS. Это напрямую влияет на безопасность сайта.
Инструменты для тестирования скорости загрузки сайта
Для проверки интернет-ресурса существует множество различных инструментов. В зависимости от задач и требований по детализации, можно использовать встроенный в Chrome плагин lighthouse (его можно найти в консоли разработчика), консольную версию, либо воспользоваться online версией PageSpeed. Последний в списке инструмент тестирования считается наиболее популярным, удобным и легким в использовании. С помощью PageSpeed можно проанализировать скорость как на десктопных, так и на мобильных устройствах.
Показатели, которые диагностирует Google PageSpeed:
- Largest Contentful Paint или скорость загрузки основного контента – ориентированный на пользователя показатель, который определяет время, за которое браузер отрисовывает самый крупный видимый объект в области просмотра. Низкий показатель LCP сигнализирует о том, что страница полезна.
- First input delayили задержка после первого ввода – одна из ключевых метрик производительности ресурса. FID измеряет время от момента, когда пользователь впервые взаимодействует со страницей (то есть, когда он щелкает ссылку, нажимает кнопку или использует настраиваемый элемент управления на основе JavaScript), до момента, когда браузер действительно сможет начать реагировать на сигналы от обработчиков событий в ответ на это взаимодействие. Это user ориентированная метрика, необходимая для измерения отзывчивости при загрузке. Чем ниже значение, тем страница более пригодна для использования.
- Cumulative Layout Shift или совокупное смещение макета позволяет определить суммарное значение смещения во всех непредвиденных случаях за все время посещения страницы. Значение показателя может быть равно нулю (смещения нет) или любому положительную числу (чем оно выше, тем значительнее смещение).
- First Contentful Paintили первая отрисовка контента – показатель, который измеряет интервал времени с начала загрузки страницы до момента, когда на экране появится первое изображение или блок текста.
- Speed Indexили индекс скорости загрузки показывает, как быстро на странице появляется контент.
- Time to Interactive или время загрузки для взаимодействия – этот показатель определяет время, когда основной контент был загружен и страница полностью готова к взаимодействию с пользователем.
- Total Blocking Time – это суммарное время абсолютно всех интервалов от первой отрисовки контента до полной загрузки страницы. Если скорость выполнения задач превышает 50 мс, то задержка будет заметной для пользователей.
Оптимизация скорости загрузки сайта: 9 основных рекомендаций
Если после тестирования скорости загрузки сайта результаты расходятся с требуемыми параметрами, следует провести ряд манипуляций, которые оптимизируют работу интернет-ресурса и исключат инциденты отложенной загрузки страниц:
- Сжать имеющиеся на сайте картинки и графику. Все изображения должны быть минимального разрешения (желательно WebP или AVIF), иметь прописанные в тэге img размеры. Для мобильных приложений и десктопных версий сайта иллюстрации должны использовать свои варианты изображения через picture.
- Сократить DOM (разметка HTML) до 800 строк. Страница не должна содержать лишней разметки, это позволяет оптимизировать код страницы.
- Включить кэширование на сервере. Такое изменение настроек позволит сохранять объемные элементы сайта в браузере. Когда пользователь повторно зайдет на страницу, она загрузится значительно быстрее.
- Запустить режим сжатия на сервере. С каждым годом вес HTML-страниц увеличивается, т.к. на сайты добавляют более качественные и тяжелые изображения и видео, CSS или JS-файлы. Включенный режим временного копирования файлов положительно скажется на оптимизации работы сайта.
- Исключить лишний код из файлов JS и CSS, которые подключены в верхней части разметки веб-страницы, т.к. это значительно утяжеляет их и замедляет загрузку сайта.
- Серверу необходимо по мощности соответстветствовать сайту. Он должен обладать не только необходимой мощностью, но и быть оснащен каналом связи с хорошей пропускной способностью.
- Подключение Js скриптов нужно делать перед закрывающимся тэгом body. Это позволит загрузить сначала весь сайт, а только потом добавить интерактивность.
- Защитить сайт с помощью HTTPS. Этот протокол не только увеличит скорость отображения страниц, но и обезопасит сайт за счет шифрования данных.
- Сделать ресурс адаптивным. Сайт должен быть полностью оптимизирован для просмотра как на компьютере, так и на мобильном устройстве.
Каждый из перечисленных способов поможет сделать сайт “легче” и улучшить его юзабилити. Остается лишь разобраться с приоритетностью реализации манипуляций, т.к. каждый сайт имеет индивидуальную архитектуру и нюансы. Часто в компании есть специалисты, которые понимают, как оптимизировать скорость загрузки сайта. Если же нет, всегда можно обратиться к digital студиям, которые подскажут как получить максимальный результат, затратив при этом минимальное количество ресурсов.
First Contentful Paint
First Contentful Paint (FCP) measures how long it takes for content to start appearing on a website. FCP is measured in milliseconds and used to assess the loading speed of a website.
This article explains how the First Contentful Paint is defined, and how to measure and optimize it. We'll also look at how it relates to other page load speed metrics.
What is the First Contentful Paint?
The First Contentful Paint metric measures how soon after opening a website the user can see some content on the page. Usually this means that text or an image have is visible.
This rendering milestone tells the user that something is happening and that the page has started to load.
FCP stands in contrast to two other metrics measuring rendering progress:
- First Paint marks the time when the page first starts rendering – unlike FCP this could be an empty box with no content marks the time when the largest content element on a page is rendered
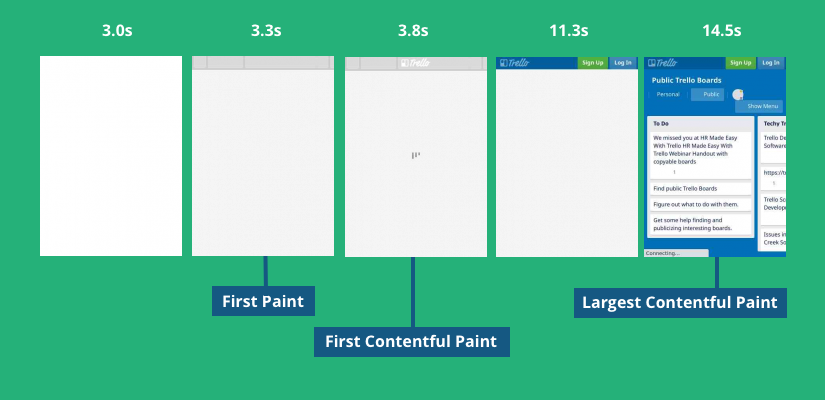
If all page content appears at the same time then these three metrics can have the same value. However, if they are different then the First Paint occurs before the First Contentful Paint, and the First Contentful Paint occurs before the Largest Contentful Paint.
This image shows the rendering progress an example website:
- At first only empty boxes are shown (First Paint)
- Then a logo appears at the top of the page (First Contentful Paint)
- Additional content appears, including a paragraph that's the largest page element (Largest Contentful Paint)
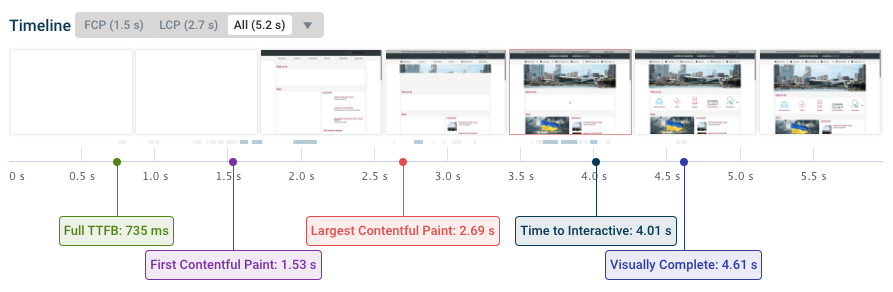
Here's another example showing the different milestones in the page load process:
-
: the initial server response
- FCP and LCP : when the CPU and network are idle : when the UI stops updating
Do background images count as content for First Contentful Paint?
Yes, if a background image is rendered the paint will be considered contentful.
What is a good First Contentful Paint?
Websites should have an FCP of 1.8 seconds or less.
While First Contentful Paint is not one of the Core Web Vitals that impact Google rankings, it is still one of Google's broader set of Web Vitals metrics. The Largest Contentful Paint is one of the Core Web Vitals metrics, and it can never be lower than the First Contentful Paint.
| FCP range | Rating |
|---|---|
| < 1.8 seconds | Good |
| < 3.0 seconds | Needs Improvement |
| > 3.0 seconds | Poor |
How does First Contentful Paint affect the Lighthouse performance score?
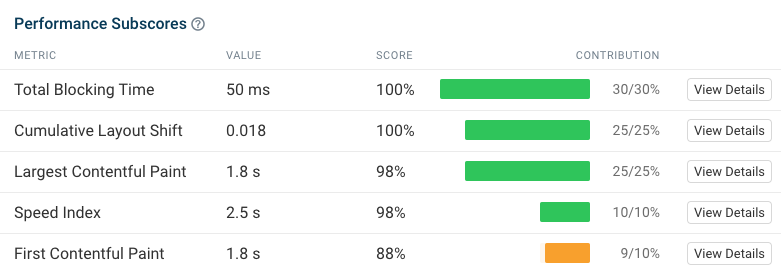
As of version 10.0.1 (February 2023) the First Contentful Paint metric accounts for 10% of the overall Performance score.
The performance subscore for FCP is visible in DebugBear for example:
This table shows the maximum value you'd need to reach for a certain FCP score.
| FCP subscore | Max FCP (Mobile) | Max FCP (Desktop) |
|---|---|---|
| 100 | 1.0s | 0.5s |
| 90 | 1.8s | 0.9s |
| 50 | 3.0s | 1.6s |
| 10 | 5.0s | 2.7s |
The initial document request requires at least 4 network round trips on an HTTPS connection (DNS, TCP, SSL, and HTTP). Lighthouse simulates a roundtrip time of 150 milliseconds on mobile, so a perfect mobile Lighthouse FCP would be 600 milliseconds.
This does not include your server response time or time the data spends traveling from your ISP to the website's data center.
On desktop Lighthouse uses a roundtrip time of 40s, so the minimum FCP would be 160ms.
How to optimize First Contentful Paint
The most common cause of a slow FCP are render-blocking scripts and stylesheets. Start by reducing the number of these resources to improve your First Contentful Paint metric.
Render-blocking stylesheets
For example, take a look at this DevTools recording of the DebugBear homepage. What resources need to load before content starts to appear on the page?
- The HTML document
- Two CSS files
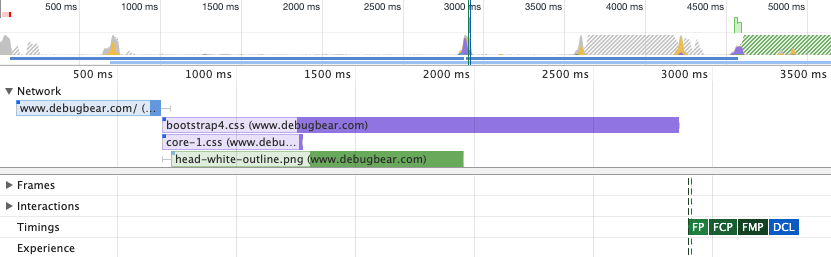
The two CSS files are render-blocking and placed in the document head element. You could avoid this by inlining the CSS directly into the document HTML as a style tag. However, this would mean re-downloading the CSS as part of every document request, rather than using the cache after the first visit.
In this case we only have three render-blocking resources. The longest request chain is 2 requests long, because both CSS requests are triggered at the same time and can be made in parallel. So overall the FCP in this example isn't too slow.
Ideally all critical CSS that's required to render above-the-fold content can be embedded directly in the document response.
Render-blocking scripts
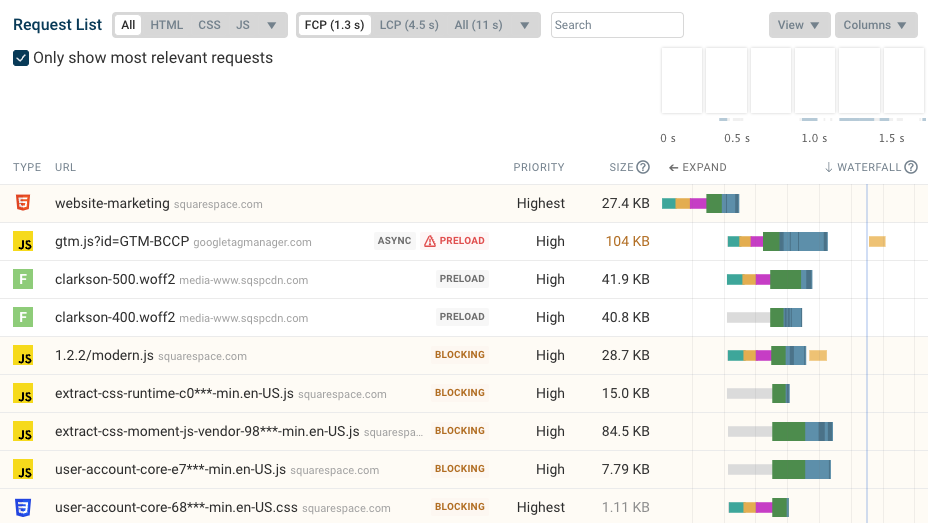
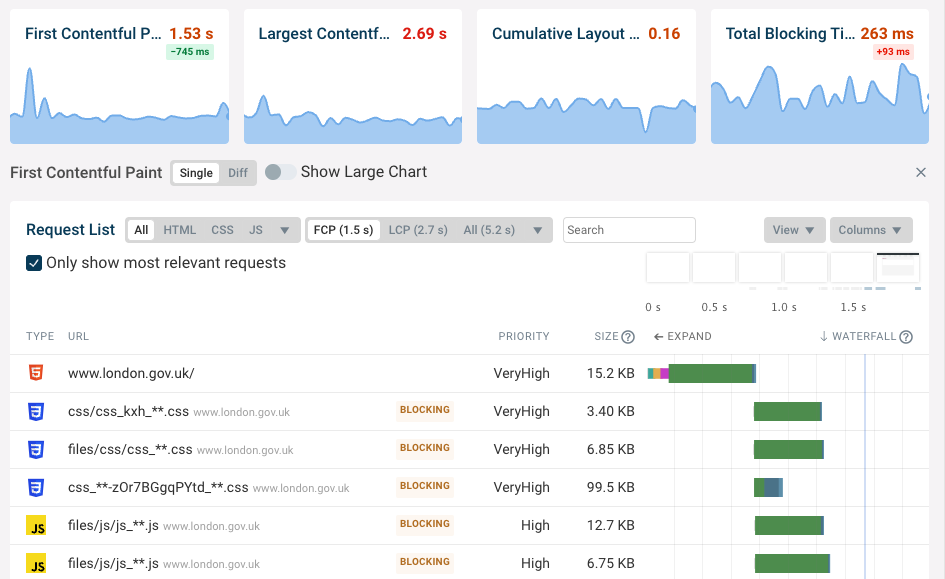
This chart shows another website, this time for a site with multiple render-blocking scripts. All of these need to be loaded before any page content starts to show.
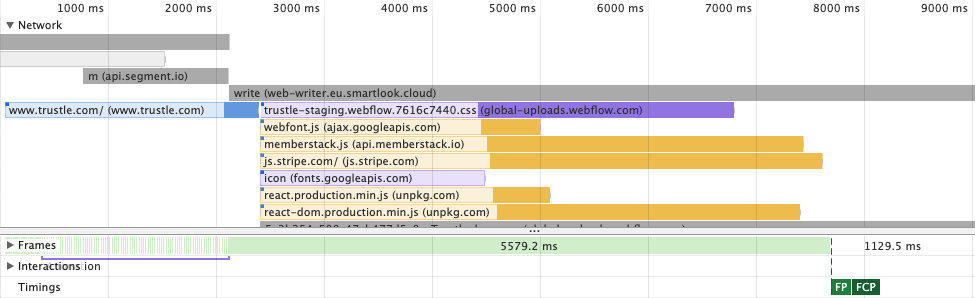
This website does not require the loaded JavaScript code for the initial render, so the script tags could be moved further down in the HTML, for example to the end of the body tag. Moving the script tags there will ensure they are no longer render-blocking. Alternatively, you can add the async attribute to the script element.
If you're loading scripts on your website, keep in mind that they not just need to be downloaded, but also parsed, compiled, and executed.
Fonts and First Contentful Paint
Web fonts are fonts that need to be downloaded before the text using that font is displayed. Accordingly, using web fonts will make FCP worse in most cases.
The website in the previous section loads a CSS file that then in turn loads a Google Font.
However, the browser doesn't block rendering until the font is loaded, thanks to the font-display: swap CSS property. This property means that if the font isn't available yet, then the browser uses a fall-back font instead. On Google Fonts you can achieve this by appending &display=swap to the CSS URL.
Reduce server response time
Stylesheets and JavaScript files are static resources, and the server can usually provide a response quickly. However HTML or Ajax responses are generated dynamically, so the server can introduce a significant processing delay.
You can check the response time of your server in the DevTools Network tab. The entry is the request for the initial HTML document. In this case, the server took 2.2s to respond and in total the request took 2.7s from start to finish.
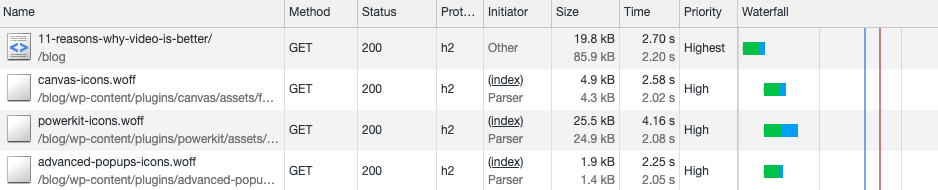
Try to keep your server's response time below 600ms to reduce First Contentful Paint.
Slow server responses are more likely if the backend is responsible for rendering the page content. For example, if you have a WordPress site with lots of plugins this can cause significant rendering delays. On the flip side, rendering content on the server also reduces processing time in the browser and avoids unnecessary network round trips.
First Contentful Paint definition
The exact meaning of the FCP metric is defined in the Paint Timing API.
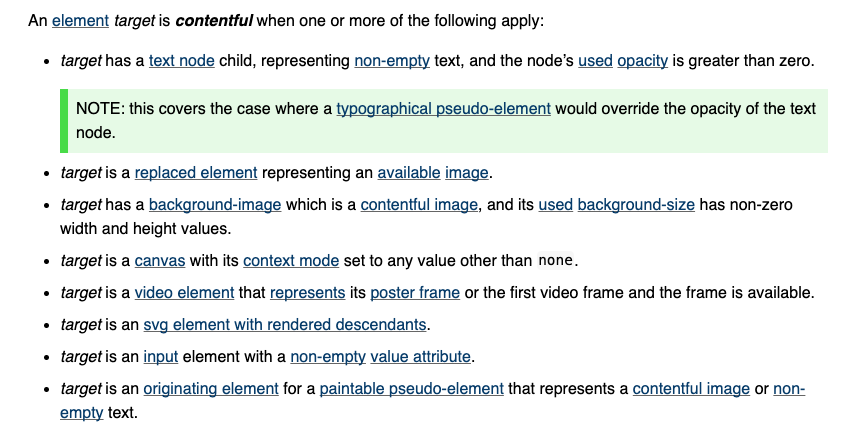
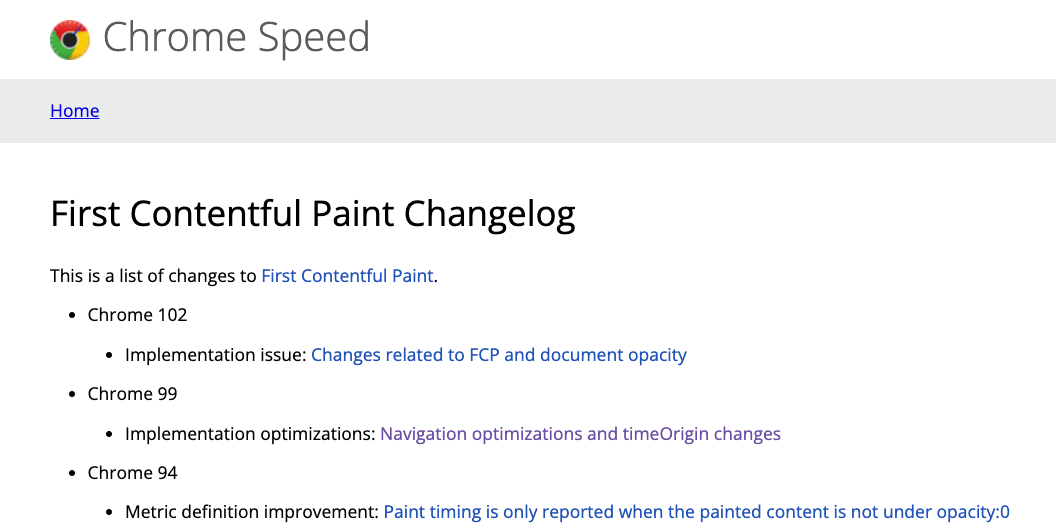
Different versions of Chrome also measure FCP slightly differently. Google also maintains a changelog of these changes. When users upgrade to a new version of Chrome you may see changes in your metric without an underlying change to your website.
How to measure First Contentful Paint
There are many different tools that can measure FCP. The data is collected in different environments, so the reported metrics can differ between tools.
To measure FCP you can use:
- Google's PageSpeed Insights tool
- The DebugBear Speed Test in Chrome DevTools
- The Performance web API
First Contentful Paint in PageSpeed Insights
Google PageSpeed Insights can provide both aggregate data from real Chrome users and run one-off lab-based tests. The real user data is taken from the Chrome User Experience Report (CrUX).
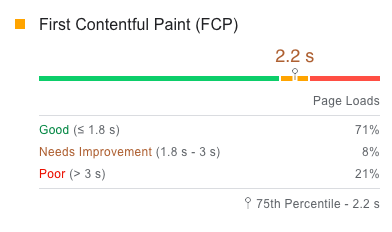
The number shown in the FCP section of the real-user data shows that 25% of users experienced an FCP worse than this value. In this example, this means 25% of user experiences had an FCP of 2.2 seconds or worse, while 75% of user experiences were faster than 2.2 seconds.
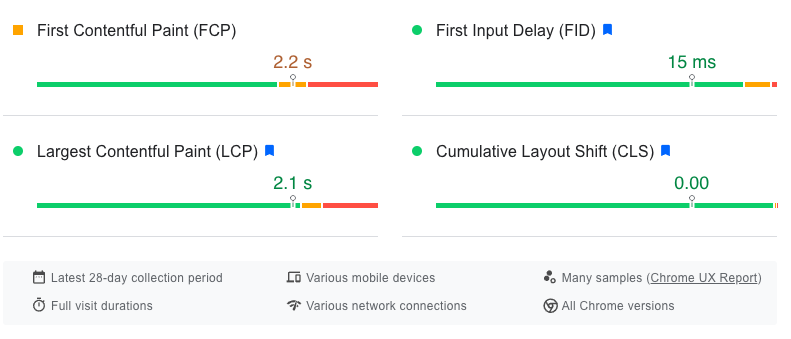
If you click on Expand view you can see a more detailed breakdown of Good, Ok, and Poor experiences.
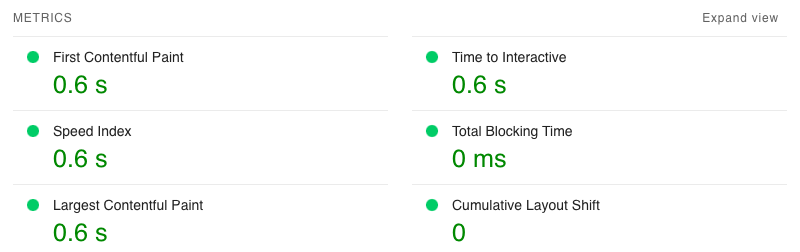
When testing a page, PageSpeed Insights also runs a one-off test from a Google server. This allows them to provide additional debug information that's not available for the real-user metrics.
The lab-based data is also useful if the page you're testing doesn't receive enough traffic to provide real user metrics.
Testing website speed and FCP with DebugBear
The free DebugBear site speed test analyzes your website and helps you understand First Contentful Paint and other performance metrics.
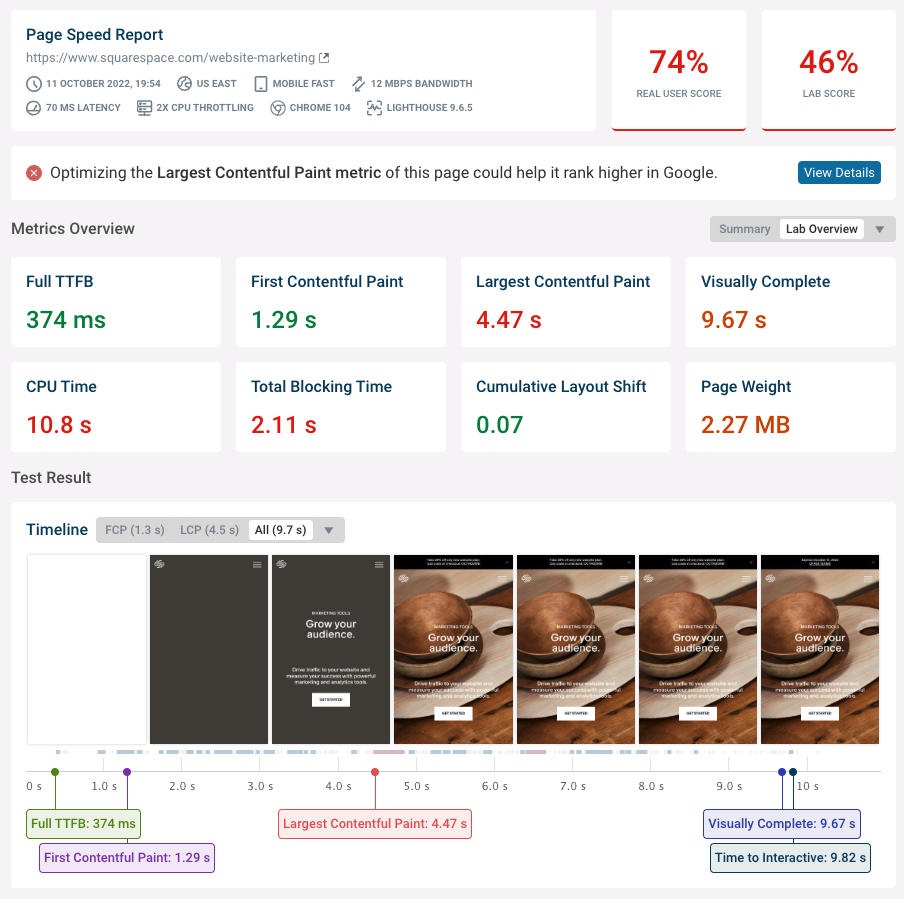
You can click on the FCP metric to view details about why the page renders at that point. The request waterfall shows what resources need to be loaded before the page can render.
The FCP milestone is indicted by the blue line. The page can only render after the render-blocking resources have been loaded.
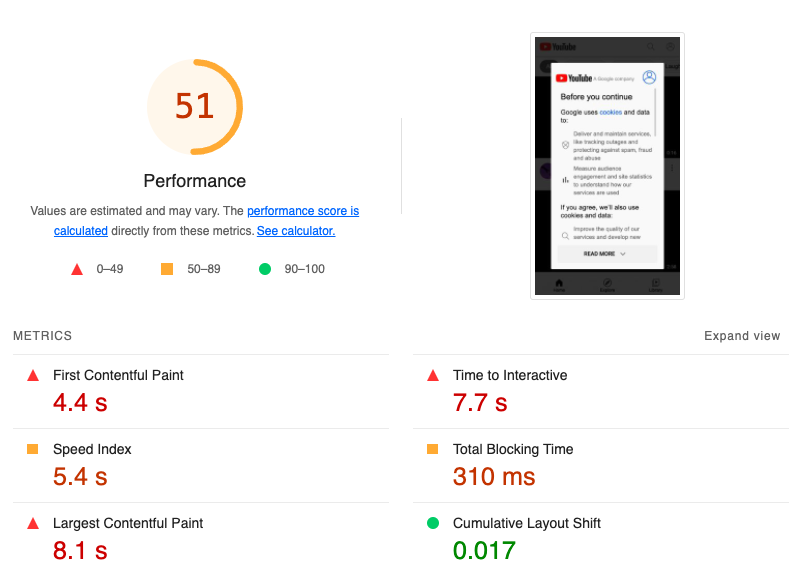
First Contentful Paint in Lighthouse
You can find the FCP in the top left of the top of the Lighthouse Performance section.
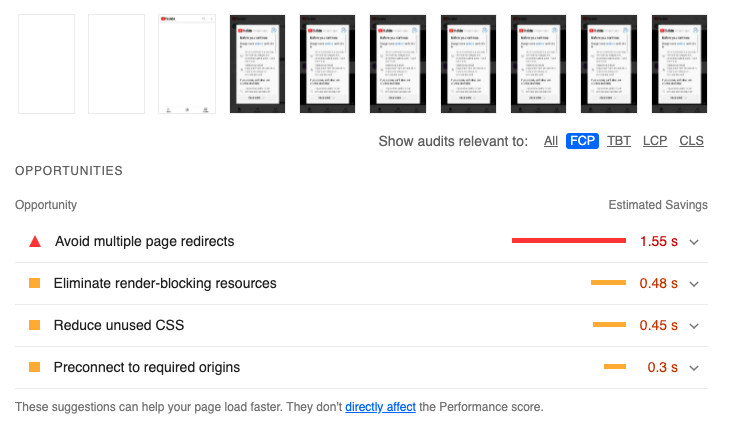
To find opportunities to improve First Contentful Paint you can select FCP in the Show audits relevant to options.
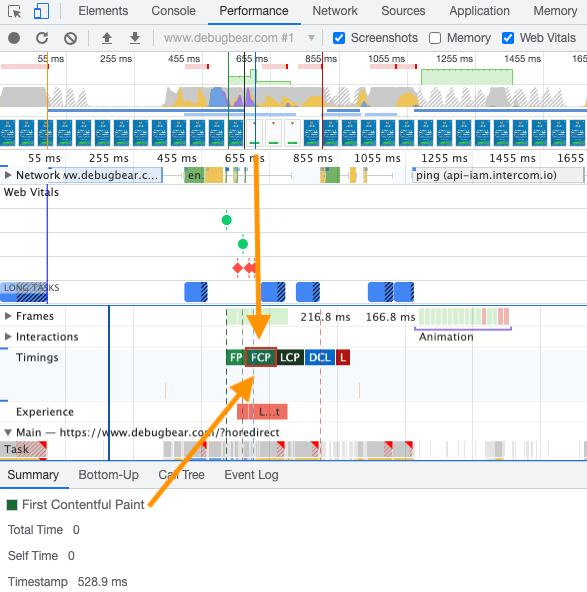
First Contentful Paint in Chrome DevTools
You can measure FCP in DevTools by creating a Performance recording.
FCP is marked in both the Timings lane and in the Web Vitals lane if you have it enabled. You can also see the rendering progress in the filmstrip.
Measuring First Contentful Paint programmatically
You can get the First Contentful Paint for current page from the Paint Timing API:
Monitoring First Contentful Paint
You can use DebugBear can monitor and optimize FCP as well as other page speed metrics.
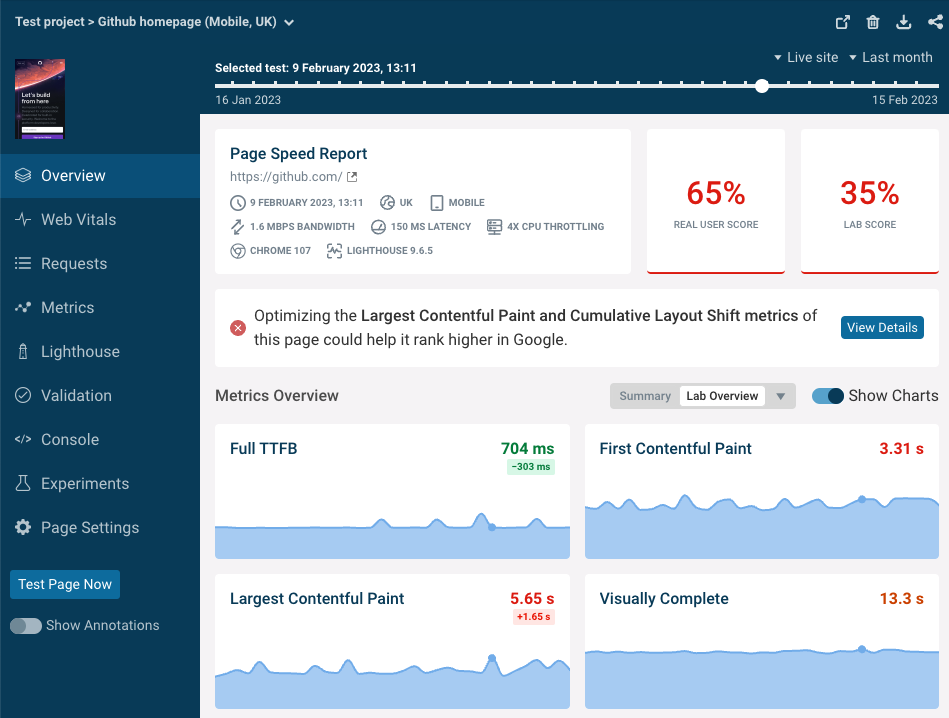
The First Contentful Paint metric is shown in the page Overview tab.
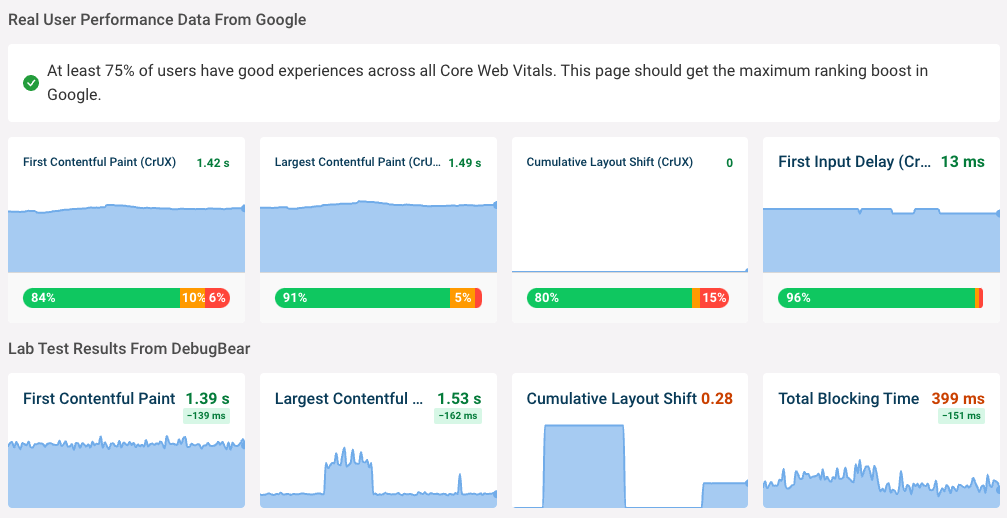
The Web Vitals tab shows both the DebugBear lab data and Google's real world web vitals data that's used as a ranking signal.
Click on the First Contentful Paint chart title to view the FCP debug view, which highlights render-blocking resources that are holding back rendering in a request waterfall.
Use the project overview to view historical web performance trends including the First Contentful Paint metric.
First Contentful Paint (FCP) and First Meaningful Paint (FMP) Explained
Whenever you are testing your website on speed testing tools such as Google’s PageSpeed Insights, GTMetrix.com you see the result with First Contentful Paint and First Meaningful Paint along with other speed metrics. These are important user-centric metrics that can tell you a lot about how long your visitors are waiting for content. Let’s give a look at the following two screenshots.
PageSpeed Insights speed report:
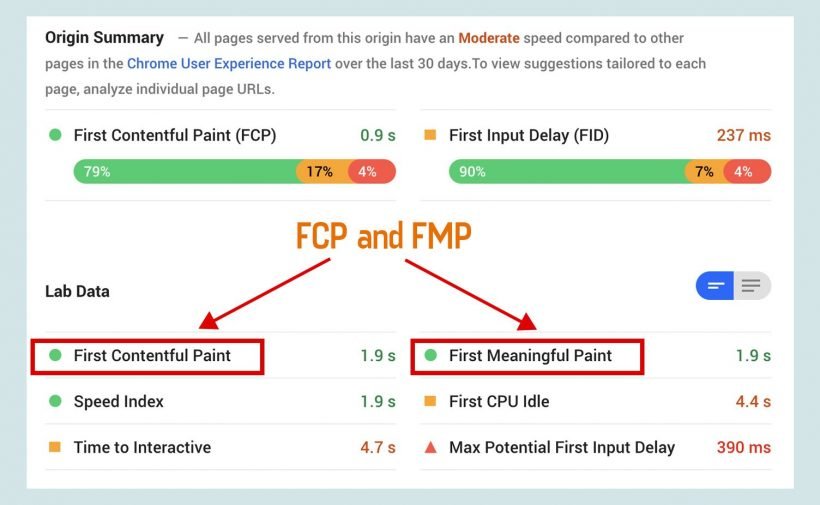
GTMetrix.com speed report:
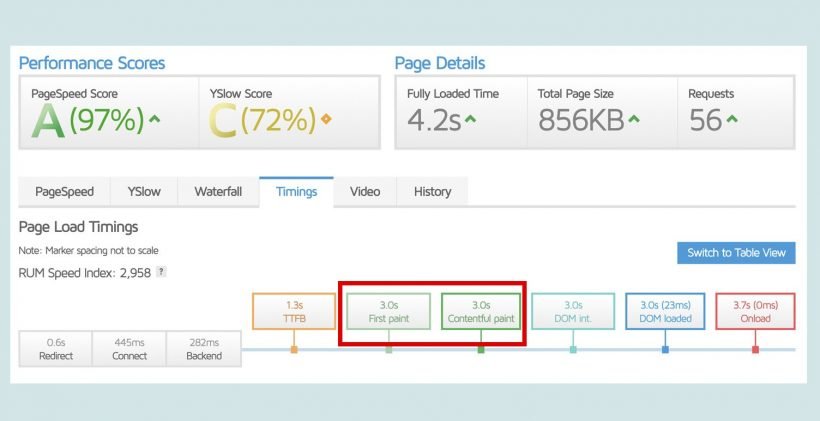
For any website, these two metrics indicate how fast is a particular website’s contents are opening on the screen. You might be wondering what those metrics exactly are. In this article, we are going to cover the First Contentful Paint (FCP) and First Meaningful Paint (MFP) in detail. Also, we discuss 4 methods to reduce Paint Times for your WordPress site in order to improve your PageSpeed Insights score.
Table of Contents
What is First Contentful Paint (FCP)?
First contentful paint (FCP) is the first content that is rendered on the screen when users browse the website. It measures the time from navigation to the time when the browser renders the first piece of content defined in the Document Object Model (DOM). This can be text, an image or canvas render.
In the case of the WordPress website, the header elements are the first content the begin render. Visitor see the site logo and the navigation menu.

There are two phases in the First Contentful Paint. First Paint, and Contentful Paint.
First Paint – First Paint is triggered when a render is detected in the browser. This could be something as subtle and uninformative as a change in the background color. The issue with this timing is that first paints can be triggered relatively early on in the page load, while not necessarily delivering any content or information to the user for consumption.
Components of websites can load in a staggered fashion and while a background color may be painted fast, actual content/interactivity may take a longer time to load.
Contentful Paint – First Contentful Paint is triggered when the first bit of content from the Document Object Model (DOM) is painted. This can be text, an image or canvas render defined in the DOM.
Because the focus is on content, the idea is that this metric gives you an idea of when your user receives consumable information such as text, visuals, etc.
The different phases of First Paint and Contentful Paint is shown in the image below:
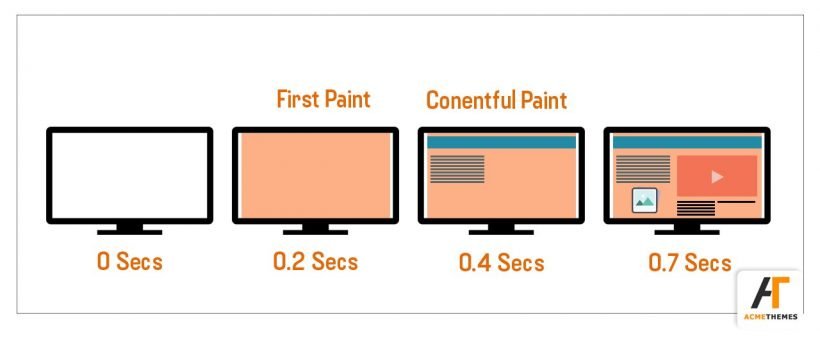
Phases of First Contentful Paint
What is First Meaningful Paint (FMP)?
When a website’s contents are fully loaded that users are looking for, that is called First Meaningful Paint. This is the time at which the user feels that the primary content of the page is visible. As the name suggests after the first meaningful paint render, it giver meaningful information to the users.
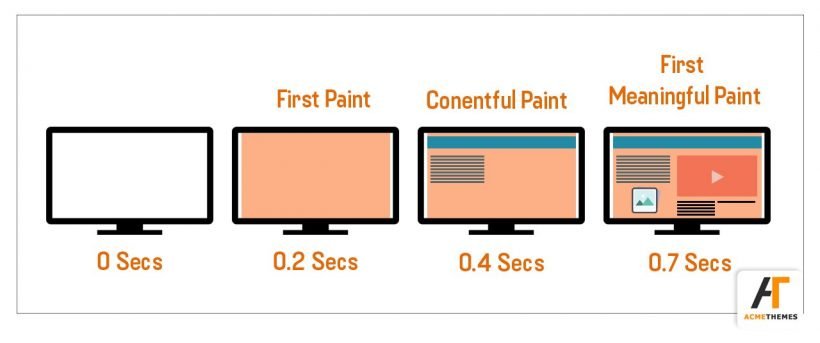
The meaningful information differs from site to site but the general practice currently is to designate the rendering of valuable content known as hero elements. Hero elements include marquees, images, and headings that are likely to be more meaningful to a user when they visit the site, making them good flags for the FMP timing.
For a blog website, hero elements could be blog posts with featured images, and for social sites, hero elements could be timelines, users profile.
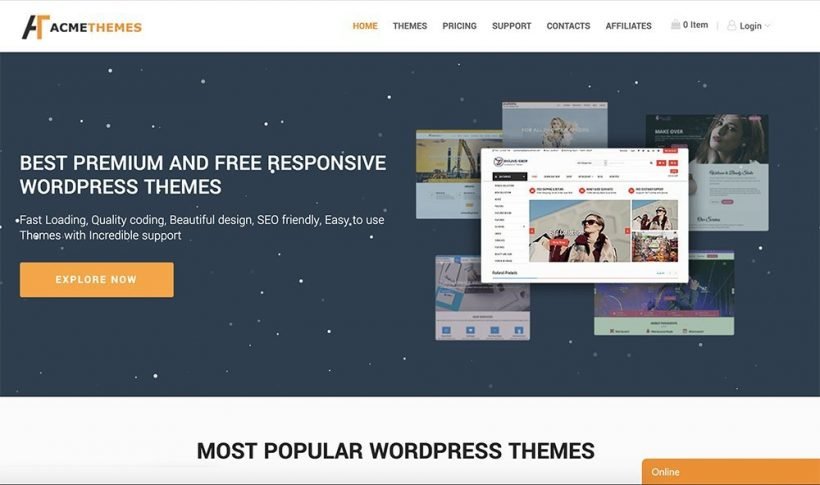
The following image shows a fully loaded website of acme themes.
How to Speed First Contentful Paint (FCP) and First Meaningful Paint (FMP)
To improve First Contentful Paint, speed up the download time of resources or do less work that blocks the browser from rendering DOM content. The following are ways to improve the website’s speed.
1. Reduce the number of render-blocking external CSS and scripts upon which the page depends.
This is the first way you can reduce the paint time of your website by eliminating the render-blocking resources. Render block is anything that is getting in the ways of rendering the Document Object Model (DOM). A CSS file is treated as a render-blocking resource meaning the browser won’t render any processed content until the CSSOM is constructed. Make sure to keep your CSS lean, deliver it as quickly as possible, and use media types and queries to unblock rendering.
2. Use HTTP Caching
HTTP caching is another way os reducing the paint time of any websites. When someone visits a website, everything the site needs to display and operate has to come from somewhere. All the text, images, CSS styles, scripts, media files, and so on must be retrieved by the browser for display or execution.
You can give the browser choices about where it can retrieve a resource from, and that can make a big difference in your page’s load speed.
3. Minify and Compress text-based assets
Your webpages consist of text-based HTML, CSS and JavaScript files. If you can’t eliminate a file because it is essential, then you need to reduce the file size as much as possible. There are ways you can reduce the file size, wither minify or compress.
- Minification: Minification refers to the process of removing unnecessary or redundant data without affecting how the resource is processed by the browser – e.g. code comments and formatting, removing unused code, using shorter variable and function names, and so on.
- Compression: Compression if the process of detecting patterns and duplication in the text file and encodes them much more efficiently.
Both of these techniques significantly reduce the paint time.
4. Optimize JavaScript
The JavaScript file is the heaviest file compared to other files for a website. Images, for instance, must be decoded, but JavaScript must be parsed, compiled, and then finally executed, taking up lots of valuable time. You can use different methods such as Tree Shaking and Code Splitting to optimize your JavaScript file.
- Tree Shaking: Tree shaking is a term commonly used within a JavaScript context to describe the removal of dead code.
- Code Splitting: It is the process of splitting up the code into bite-sized chunks and moving the chunks that aren’t critical out of the head of your site, reducing the first paint time.
Summary
Talking about reducing the page load time, this is just one perspective (technical solution) that speed testing tools consider. There are various other factors that affect website loading speed.
Both First Contentful Paint and First Meaningful Paint should be less than a second for the best user experience. Because these metrics are user-centered metrics that can tell you a lot about how long your visitors are waiting for content. So, you can follow the above-listed methods to reduce FCP and FMP. Check out your site’s page speed at Google’s PageSpeed Insights and find out the status of your website.
Other SEO Articles:
If you liked this article, then consider following us on Twitter and Facebook and LinkedIn.
What is First Contentful Paint (FCP)?

What comes to mind when you’re on a website and nothing seems to be happening—for a considerable amount of time? You’re probably wondering—is this website broken? In most cases, it’s likely not, but it takes far too long for any content to appear on your screen. Then, there’s finally some activity on your screen, you relax, assured that the website isn’t broken.
The time it takes for that content to show on your screen is known as the First Contentful Paint (FCP).
In this article, we’ll do a deep dive on this metric and how to measure and optimize it for a good user experience. We’ll also look at some common causes of FCP delays and how you can avoid them.
What is First Contentful Paint (FCP)?
First Contentful Paint (FCP) is a user-centric metric that measures the time it takes the browser to render the first piece of DOM content (SVG, image (including background images), text, or non-white canvas) on a page.

In other words, FCP is the total time taken between your initial page load event to the point any content renders on a user’s screen. It answers the question, “is the page loading or not?”
As one of Google’s web performance metrics, the FCP contrasts with other technical or quantitative metrics. The concept of FCP is based on “user experience” i.e., providing feedback to user’s input when they’re on your website. This way, they can perceive a change in your website’s layout, giving them the impression it’s responsive.
According to Lighthouse, the first contentful paint accounts for 10% of the overall performance of a website.

So, to have a fast website, you need to optimize your FCP to give the best user experience. On the other hand, different elements are likely to trigger your FCP and provide a good or bad user experience depending on the page load event.
A quick example is a loading animation on your website; if this pops up on a user’s screen and the website doesn’t fully load in the next few seconds, it gives a bad impression.

This is why FCP is considered one of the metrics based on perceived load speed, because it’s based solely on the user’s experience when the website loads. There’s a common misconception between the first contentful paint, first paint, and largest contentful paint due to how these metrics are focused on how websites render for users.

Difference Between The First Contentful Paint and First Paint
The FCP takes on two phases before it happens:
- The First Paint
- The Contentful Paint

The First Paint (FP) occurs when there’s any change in the current display of your web page. This metric measures the time for the browser to render the first pixels on the user’s screen. Anything rendering in the user’s viewport triggers the first paint.
This metric’s issue is that first paint can easily be triggered early on during the page load event without any meaningful content for users to interact with. In cases where the background color of a website changes, it triggers the FP—even though the main content or any form of interactivity takes longer.
On the other hand, the Contentful Paint focuses on when the first content from the Document Object Model (DOM) is painted.
Bringing these two together, we have the First Contentful Paint (FCP) that measures not just any paint but the first paint with content that users can interact with. And speaking of interactivity, the Largest Contentful Paint is often prioritized over the First Contentful Paint because it accounts for 25% of the overall performance of a website—but both metrics measure different things.
Difference Between The First Contentful Paint (FCP) and Largest Contentful Paint (LCP)
When considering paint-related metrics for measuring your website’s performance, which is more important—the LCP and FCP? Both are important if you know how they work.
Unlike FCP, which measures the time it takes the first content from the DOM to be painted, the LCP is different.
The Largest Contentful Paint (LCP) measures the time it takes the largest DOM content above the fold to load and become visible in the user’s viewport. Unless the LCP loads, the user will likely not fully interact with the page because it hasn’t readily shown any sign of interactivity.
The downside to LCP: it doesn’t consider the elements that load on the web page before the largest DOM content loads—this is where FCP comes in.

FCP serves as the first feedback users get in response to their request for a web page from the browser. With this, FCP can measure the time taken for the first DOM content to load—all based on the user’s perspective.
What’s a Good FCP Score?
According to Google, your FCP should occur within 1.8 seconds or less to provide the best user experience.

In determining your FCP scores and other metrics, Google compares your FCP time with real websites based on data from the HTTP archive. With this, Google splits the results into three categories, namely — good (green), needs improvement (orange), and poor (red).
-
Good — 0 seconds to 1.8 seconds
How to Measure Your FCP
Measuring your FCP can be done either with Lab Tools or Field Tools. Depending on the tools you choose, the results vary, but not widely.
- Using Lab Tools to Measure Your FCP
Checking your FCP with lab tools simulates users’ experience when they visit your website under ideal situations. Some of these simulations include network, bandwidth, latency, and browser configurations.
Examples of lab tools include:
- Using Field Tools to Measure Your FCP
Using field tools provides far more accurate results than lab tools due to how it tracks your page experience to users in real time. This means you’re getting results based on real user experience while on the website.
Examples of field tools include:
Using PageSpeed Insights to Measure Your FCP
PageSpeed Insights is one of the tools Google recommends for measuring your website’s performance. It’s a simple-to-use tool that provides a cumulative score on your overall performance, along with recommendations on how you can improve where you fall short.
To use PageSpeed Insights, go to the website ( https://developers.google.com/speed/pagespeed/insights/) and insert your website’s address.
In this case, the website we’ll be testing is ours—Edgemesh.

By clicking analyze, the tool analyzes your website’s performance and gives you a score ranging from 0-100 based on the Lighthouse Scoring Guide.

When the page loads, scroll down and see your results—one of which is your FCP score. In testing our website, we had an overall performance of 98/100, and our FCP score was 0.9 seconds.

These results put us in the green zone—so we’re on google’s good side.
If you have low to mid results for your FCP score, scroll down to the audit section and note what caused it.
In the audit section, you get three categories:
-
Opportunities—Suggestions that can help improve your FCP and load your website faster.

-
Diagnostics—Complete diagnosing of your current FCP and what you can improve. Here’s where you’ll know exactly what caused the drop in your FCP score.
-
Passed Audits— The passed audits are all you did right relative to your current FCP score.

By identifying the drawbacks in your current performance, you can go to your website’s backend and provide the best solution to the problems. Doing this frequently gives you a better chance of providing your users with the best on-page experience—and this trickles down to your bottom line, improving your overall conversion rate.
Using WebPageTest to Measure Your FCP
The WebPageTest is a lab tool that allows you to test your website’s performance by emulating any device with your preferred connection. To use WebPageTest, visit the website (https://www.webpagetest.org/) and set your preferred connection (advanced settings) after inserting your website’s address.
By clicking start test, the tool analyzes your website and provides you with a detailed result of your overall performance—FCP included.
When the test is complete, you get a breakdown of your performance results. For example, we got 0.84 seconds as our FCP score—and remember, we got 0.9 seconds using PageSpeed Insights.

And if you’d like to get more detail, you can scroll down to each “run” and click on “filmstrip view” to see how your FCP score compares to the other metrics of your website.


Unlike PageSpeed Insights where you can easily identify factors causing you to have a poor FCP score, the WebPageTest tool doesn’t provide that by default unless you’re drilling down on every process in your entire loading event.
Back to the FCP scores, you can see the difference between the scores from both tools—0.84s and 0.9s. Even though the tools you use will likely be different, the results will always be within a close range for you to understand how to best optimize your website.
7 Ways to Improve your First Contentful Paint
Now that we’ve covered how you can measure your FCP, the next step is knowing the best ways to improve it. Below are seven ways to improve your FCP.
1. Enable Client-side Caching
The problem with a poor FCP is the time it takes before any content renders on the web page. An excellent way to solve this is by caching your website so that you can keep a copy of your website in the nearest accessible place for the user on their next visit.
However, when it comes to caching, there are two types—you can either cache on the server side or client side. By default, most of your website resources and loading events will be from the server side, and the downside to this is the time it takes for the server to respond to the browser’s request.
By caching on the client side, you’re keeping a copy of your web page on the user’s device without the need for the user’s request to go back to the origin server before it displays. When you do this, there’s a reduction in the overall workload done by the browser and the server. This will create an instant boost in your FCP score and overall website performance.
For the best client-side caching provider, Edgemesh Client gives your users a good on-page experience.

2. Reduce Your Time To First Byte (TTFB)
Time to First Byte (TTFB) is a web performance metric that measures the responsiveness of a website’s server to the browser request.
This metric determines how fast the server responds to a request. You can take the TTFB as the “server response time.” If it takes a long time for the server to respond to a request, the FCP will always be slow regardless of optimization.

FCP and all other metrics on your website depend heavily on your TTFB—to be safe, aim for a TTFB of 0.1-0.2seconds. If your TTFB is higher than that, then try improving your HTTP request and response time and request processing time.
3. Eliminate Render-Blocking Resources
The term render-blocking resources is anything that interrupts the painting of the first DOM content. Before a website can render in the user’s viewport, the HTML document representing the website contains Javascript and CSS files that must function properly.
When there’s a request for a web page, this HTML needs to parse, read the HTML document and then construct the DOM before it renders. If this process is successful, without any interruption, the website will render without any issue.
Rendering can be interrupted or slowed down when CSS and Javascript files block the main thread. When this happens, your website becomes inactive, and there won’t be any DOM content to paint—thus giving you a poor FCP score.
To get a better FCP score, here are ways to eliminate render-blocking resources,
- Defer the Javascript Loading
- Minify your Javascript and CSS files
4. Generate Critical CSS and Inline It
CSS is responsible for styling your website the way you want it to be. So, CSS makes anything relating to colors, layout, and fonts possible. It also makes your website presentable and accessible on screens of different devices.
There are two ways you can set CSS to load when your website loads—either Defer the CSS or let it load Asynchronously.
If you load your website’s CSS asynchronously, your website will display in an unstyled manner, i.e., your website won’t render in the order in which it appears. When this happens, you get a poor FCP score because even though it loads on time, your website doesn’t give users the perceived load speed.
On the other hand, deferring your CSS allows the browser to execute the styles that appear in the markup.This doesn’t mean issues like Flash of Unstyled Content (FOUC) won’t occur and give users a bad experience. The best way to prevent this is to generate critical CSS and inline it directly in your HTML file. This lets your page display main elements like your site header, logo, and default text without the need to load your CSS file fully.
5. Don’t Lazy Load Images Above the Fold
Lazy loading images is a common technique used to speed up websites. This means deferring loading images that aren’t visible in the user’s viewport. When the user scrolls or gets to a place on the web page where it needs this image, the image loads.
The downside to this technique: it affects your FCP if you do it for above-the-fold images. This is because the script that makes lazy loading works is Javascript—and during the initial page load, if the Javascript task doesn’t fully execute, the main thread will be blocked.
As a result, try and exclude above-the-fold images. Several plugins like WpRocket have this feature and can help you exclude images, image classes, image sources, and even avatars.
6. Reduce Your DOM Size
Your DOM (Document Object Model) is a representation of your entire web page. DOM is structured in a way that allows for all objects pertaining to the function of a website to be directly inside the DOM tree.

In a DOM tree, all HTML elements are called nodes. These nodes are able to branch out into multiple elements without any limits. How deeply these nodes branch out is called the node depth. The sum of each node depth is called the tree depth. The main element of each node is called the parent element, and all of the nodes under that element are called the child element.
This breaks down the structure of the DOM tree. If your DOM tree is large and unoptimized, there’ll be many nodes invisible to the user during the initial page load event. There’s a slow processing time in the backend for the browser to parse and render each node when this happens. The time taken for elements to render will cause your FCP to drop as a result.
Google’s browser engineers recommend pages containing fewer than 1,500 DOM elements, a tree depth <32 elements, and fewer than 60 children/parent elements.

If your website exceeds these requirements, you’ll be penalized, affecting your FCP score and overall web performance.
Below are five ways you can reduce your DOM size:
- Avoid the excessive use of <div> tags from plugins, themes, and page builders
- Remove unimportant content on the web page
- Split large pages into smaller ones
- Choose optimized themes
- Lazy load elements—not just images
7. Avoid Multiple Page Redirects
When users visit your website, it redirects them to another URL. The server will return an HTTP 301 redirect status code response.
HTTP/1.1 301 Moved Permanently
Location: /path/to/new/location
When this happens, the browser must make another request to the new location to give an actual response to the user’s main request. This extra round trip time creates a network latency that affects your FCP and delays the rendering of any paint on the website even though it loads.
Multiple redirects like that can delay the loading and rendering of resources by hundreds of milliseconds.
Lighthouse flags web pages with two or more redirects.

The best way to eliminate these redirects is to point the flagged resources directly to their final destination instead of going through an unnecessary round trip.
On a Final Note
FCP is a vital metric in the overall performance, especially as it solely focuses on user experience. Having a poor FCP score, i.e., above 3 seconds, shows a bad user experience, leading to an increase in bounce rates. The best way to avoid this is by following the methods we’ve discussed in this article and make the best of your website experience for users.
Quick question, what is your current FCP score, and what are you looking to improve?
We’d be happy to hear from you.
If you made it to the end of this article, that means you’d be interested in the rest of this series.
Below are related articles we think you’ll find helpful:
Do customer experience, good conversions, low bounce rates and overall, speed matter to you? Then you’ll love Edgemesh’s Enterprise-Grade Web Acceleration.
Our intelligent, automated, and next-generation client-side caching readies your website to move at full speed—with just a single line of code.
Plus, it takes less than 5 minutes to set up. What do you say?
Start your 14-day trial to get a feel for what page speed means to your business.