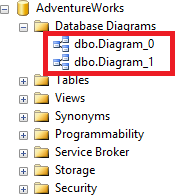
SQL Server Database Diagram Tool in Management Studio
Often sophisticated tools such as ER/Studio or ERWIN are used to create database diagrams, but these are not necessary to create simple database diagrams, print them or convert to a Microsoft Word document or to PDF to save and share with your team. In this tip we will walk through how to create a database diagram using SQL Server Management Studio (SSMS).
Solution
Using Microsoft’s sample database WideWorldImporters, I will demonstrate creating a simple database diagram of a limited number of tables focusing on Invoice related tables in the database. I’ll then copy the Database Diagram to MS Word so it can be saved and printed.
Step 1 – New Database Diagram using SQL Server Management Studio
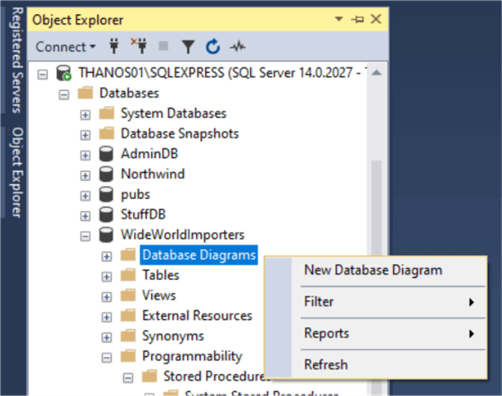
In SSMS under the database WideWorldImporters, right click «Database Diagrams» and select «New Database Diagram».
Step 2 – From Database Diagram – Select a table
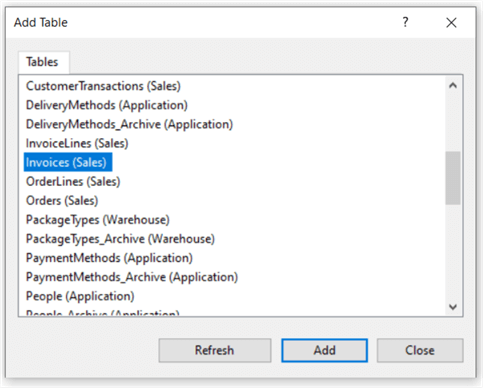
From the Database Diagrams tool dialog scroll and select Invoice table. Press Add and then Close.
Step 3 – From Database Diagram – Add Related tables
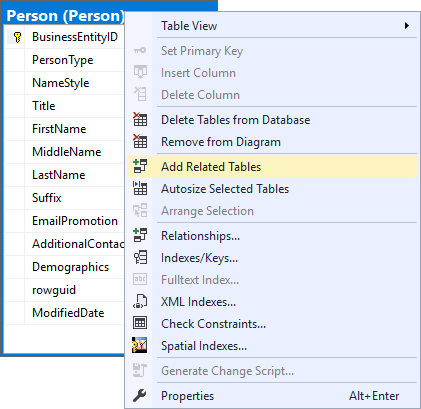
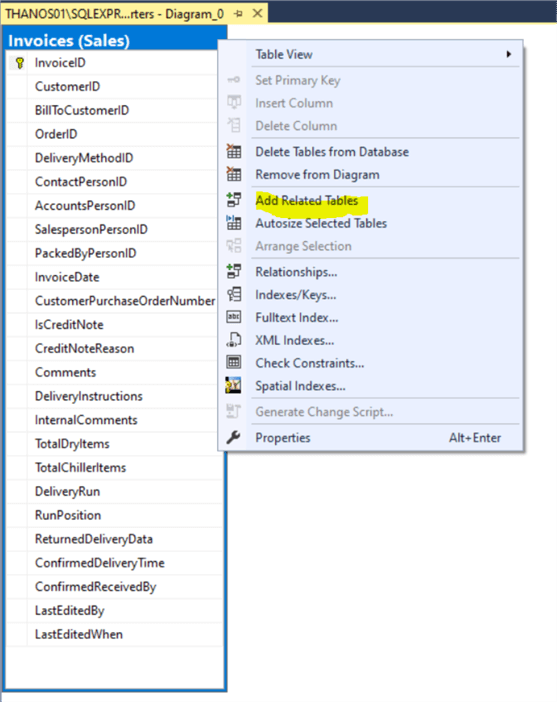
Right click the Invoices table and select «Add Related Tables«. This automatically adds tables linked to the Invoices table by Foreign Keys of which the Invoices table is a foreign key.
Step 4 – Eliminate Unwanted Tables from the Diagram
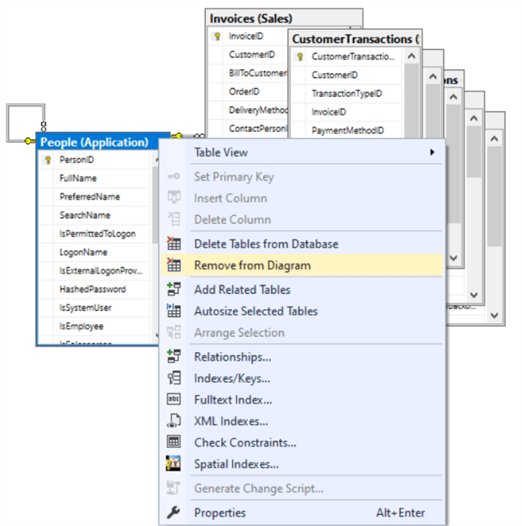
Right click on any table that might clutter the diagram and that you feel is not important and select «Remove From Diagram«.
Step 5 – From Database Diagram – Auto Arrange Tables
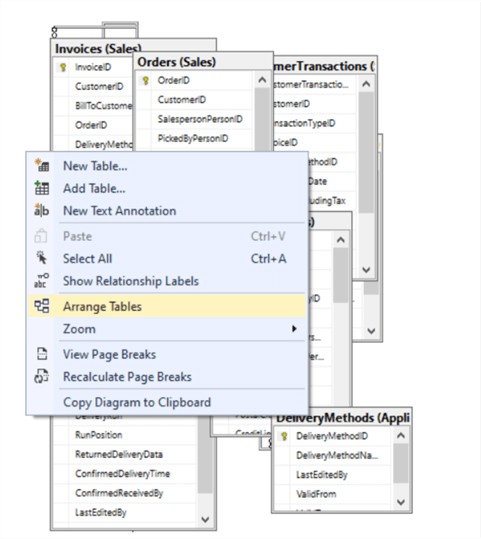
Right click the Invoices table and select «Arrange Tables«. This organizes the tables with out overlapping.
Step 6 – From Database Diagram – Adjust the Layout
You can do the following:
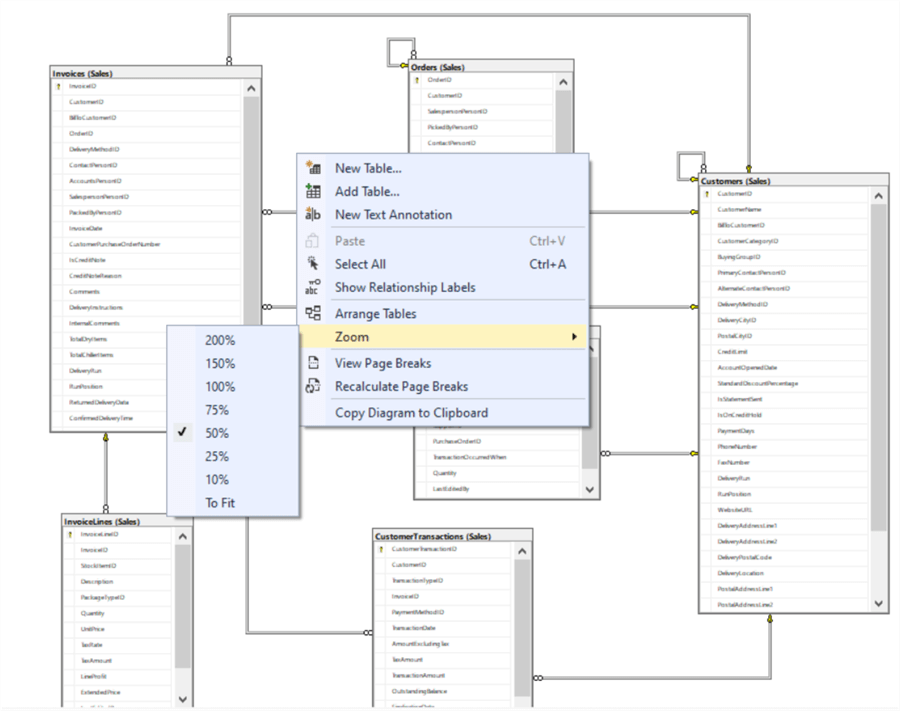
Right click to select a Zoom level to see your tables.
Drag a table to adjust the positioning.
Click a table and put the cursor on the edge to resize the table layout.
Step 7 – From Database Diagram – Auto Size All Tables
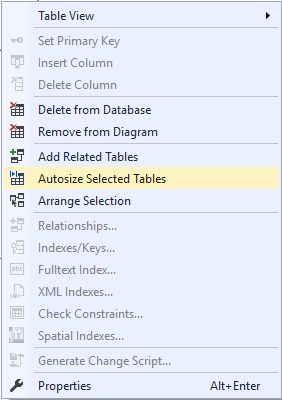
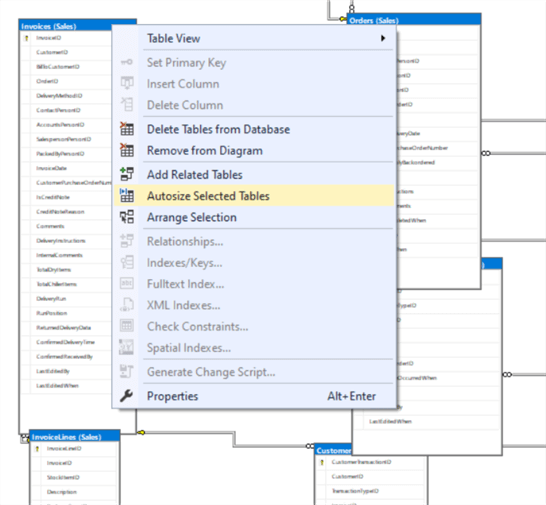
Use CTRL + A to select all tables. Right click any highlighted table and select «Autosize Selected Tables«. Select and drag the connector lines to rearrange.
Step 8 – From Database Diagram – Copy to Clipboard
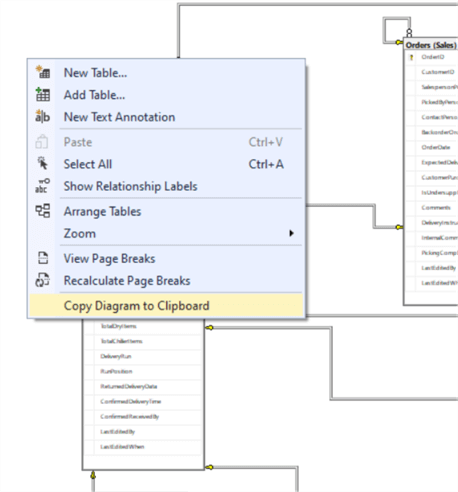
Once the Diagram is sized and arranged as desired, hit Save and give your Diagram a name. Then right click any white space in the Diagram and select «Copy Diagram to Clipboard«.
Step 9 – Paste the Diagram to MS Word
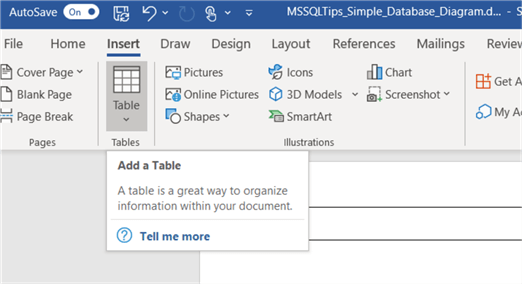
Open Microsoft Word. Insert a single cell Table and paste the Database Diagram in the cell.
Step 10 – In Word Adjust and Maximize the Database Diagram Image
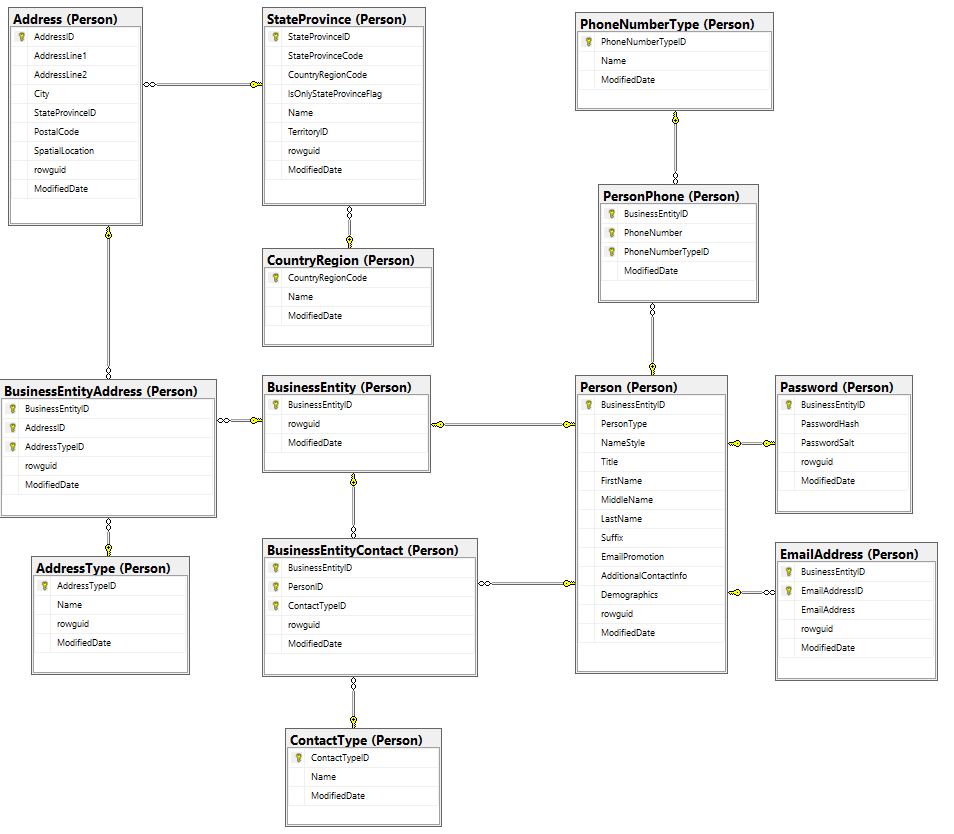
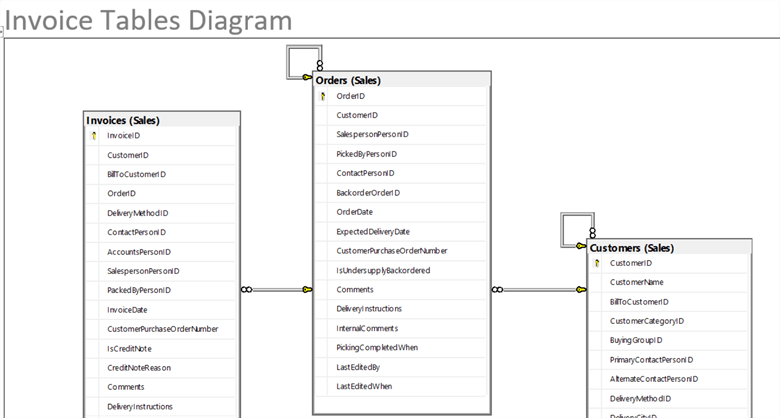
Adjust the Word document to maximize the database diagram image. Change the margins to .5 inch, enter the image and resize it to enlarge. Below is a snippet from a Word document Database Diagram.
Wrap Up
Once the diagram is in Word you can print it, share it, or save as a Word Doc or PDF file. This is an effective way to create simple limited Database Diagrams that can be leveraged when documenting your database. I find creating partial database diagrams around logical groups of tables a good way to document a database. There are other options that can be done in SSMS Database Diagrams such as only showing the Table Names and Relationships or only displaying the Key Columns which may allow more tables to be added to the Database Diagram and still fit in a Word document.
Next Steps
Also check out more on Reverse engineering a database
For addition details about SSMS Database Diagrams read Getting Started with SQL Server Database Diagrams
Learn more about Working with Database Diagrams from Microsoft SQL Docs
Check out these other articles for SQL Server Management Studio
About the author
Jim Evans is an IT Manager currently for Crowe who has managed DBA, Developer, BI and Data Management teams for over 20 years.
Article Last Updated: 2022-04-06
Comments For This Article
Thursday, August 11, 2022 — 4:07:55 PM — Izhar Azati
Back To Top (90371)
But there is a problem with printing from SSMS when there is also the «IS NULL» column. The problem has existed for several years. The checkbox print very large.
Sunday, October 18, 2020 — 5:32:34 PM — Amira Ali
Back To Top (86655)
Thank you so much, please keep up the good work!
Sunday, May 17, 2020 — 11:29:44 AM — Jim Evans
Back To Top (85681)
Hello Ali — Thanks for reviewing the article.
When in SQL Server Management Studio with your database diagram opened and created, right click the link between two tables and go to Properties. Expand «Tables and Columns Specifications» to see the Primary Key and Foreign Key column names.
Hope this helps,
I need to know which columns from two tables are in relation, i.e. which column from master is private key and which column from detail is foreign key, as sql server data diagram does not automatically point to these columns. how can I do that?
Thanks in advance
Thanks for the post Ray. It is good to point out that you can modify database schema using the Database Diagram tool. Personally I only use the Database Diagram tool to get a picture of what is there and not to design the database. Note, to create Database Diagram via SSMS you must be a member of the db_owner role. Being a member of the db_owner roles comes with great responsibilities and understanding and the need to be cautious to avoid unintended mistakes.
I have avoided the diagram feature for years, and discouraged my developers from using it also. Early on we had some bad experiences with folks making unintential (and unrecorded) changes to data bases. :).
How To Create Database Diagram In SQL Server SSMS
Database diagrams are visual representations of underlying table structure and their relationships. Generally referred to as ER (Entity-Relationship) diagram. With database diagrams, we can easily identify the list of tables in a database and their association through the type of relationships. Moreover, it also provides the overall structure with listed tables, their keys and relationships.
Importantly, this can help us to quickly glance and study the overall database structure. We can save and share or print it for future references. In this tech-recipes post, we will learn how to create database diagrams within SQL Server management studio. Also, we generate multiple database diagrams for a single database at each instance to understand how the database structure has changed over the course of the development cycle.
Database Diagram Represents
1. Table structure and included columns. 2. Type of key – Primary Key & Foreign key 3. Relationship between tables – One to One, One to Many and Many to Many
How to Create Database Diagram In SSMS
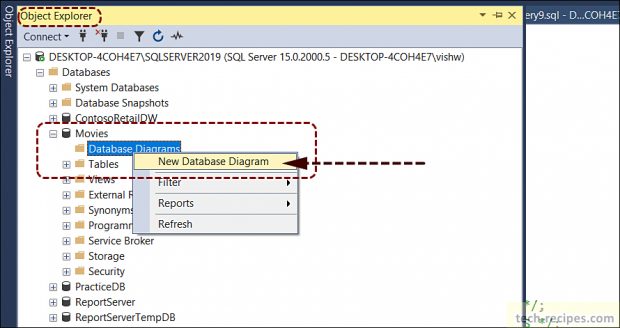
1. Navigate to Object Explorer in SQL Server Management Studio.
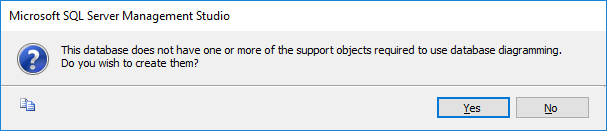
2. Expand the database and right-click on “Database Diagram”. Allow the pop up which checks for the permission to create a database diagram.
3. Right-click on “Database Diagram” folder and select “New Database Diagram”.
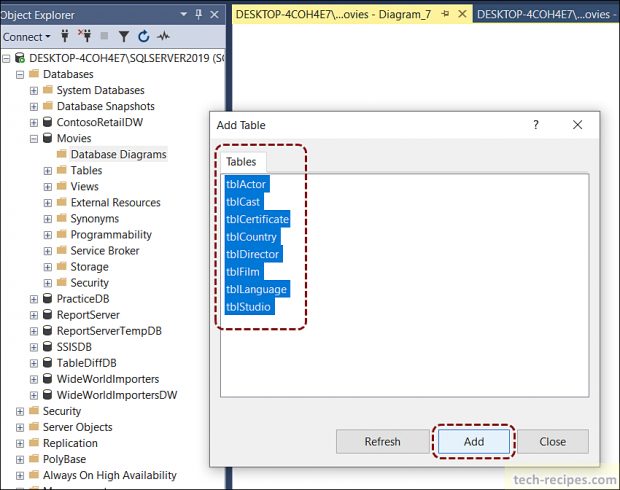
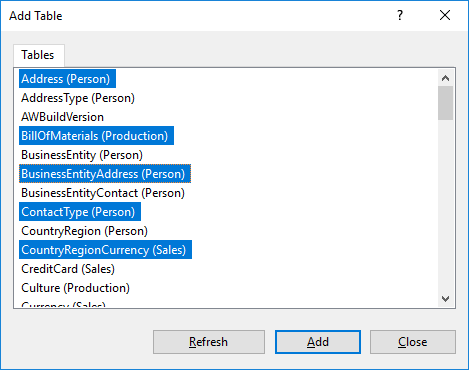
4. Select the list of tables you want to put in the database diagram, you can select important tables and click Add.
5. You can right-click on the diagram page and arrange tables/zoom, show relationship labels as per your need.
6. Go to the File menu and click Save “Diagram” and assign the name. Once a diagram is saved then it will be always available under the “Database Diagram” folder.
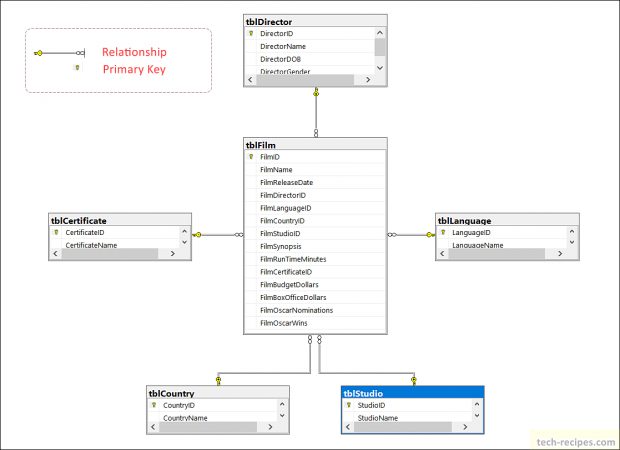
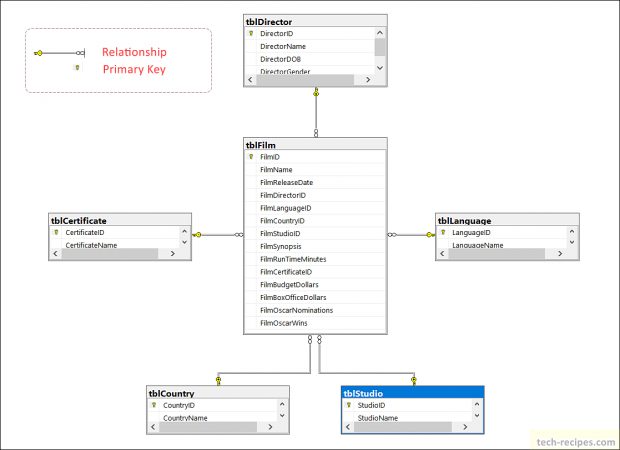
Database Diagram – Movies Database
Points to ponder on Movies database diagram.
1. A relationship is represented between tables using an arrow and key signs. You can right-click on the arrow go to properties and understand the primary and foreign key columns used.
2. Primary key & Unique key is represented in the table structure with a key symbol next to the column name for quick identification.
3. In case you have many tables and the diagram is scattered, you can adjust zoom accordingly.
4. You can save the diagram from the File menu for future references.
5. Anytime if you want to add an existing table to the diagram, you can right-click on Add Table.
Summary & Read More
In nutshell, we have learned how to save database diagram in SQL Server management studio. Using a database diagram we can glance over database structure and relationship with ease. This file is shareable and can be saved for future references.
Read More and browser through more posts related to SQL Server on Tech-Recipes.
MS SQL Server — Как создать диаграмму БД со связями
Диаграмма базы данных (далее -БД) — это графическое представление таблиц БД с визуальным отображением связей между таблицами по внешним ключам (англ. foreign key).
Для того, чтобы в MS SQL Server построить диаграмму БД необходимо:
1. Открыть консоль MS SQL Managment Studio
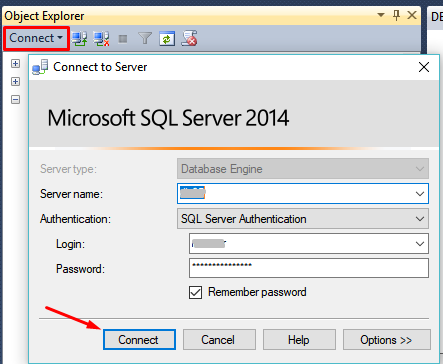
2. Подключиться к нужному серверу:
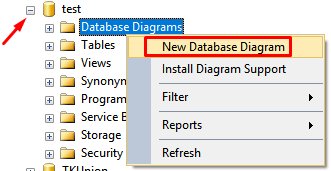
3. Раскрыть список «Databases» — «Наименование БД» (в данном случае «test»). На каталоге «Database Diagrams» нажать правой кнопкой мыши и выбрать «New Database Diagram»:
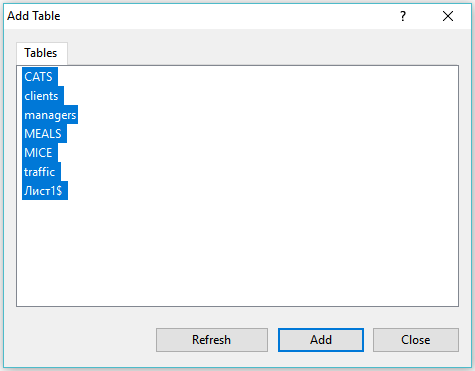
4. В окне «Add table» необходимо выбрать таблицы, которые необходимо включить в диаграмму для отображения:
После чего нажмите кнопку «Add«.
В случае, если по каким либо причинам в MS SQL Server Managment Studio не удается построить диаграмму — возможно воспользоваться сторонним ПО, например, универсальный DBeaver.
Как создать диаграмму в sql
Supported Technologies
Metadata Management: Why Start Now?
By Use Case
By Industry
By Technology
Why Dataedo?
Dataedo Cartoons
General
Dataedo
How to create ER diagram for existing SQL Server database with SSMS
Article for: SQL Server Management Studio (SSMS) ▾ MySQL Workbench Oracle SQL Developer DataGrip Toad for Oracle Toad for SQL Server IBM Data Studio
Please note that SSMS 18 no longer supports diagrams. Check out an alternative.
In this tutorial, I will show you how to create an ER diagram with Microsoft SQL Server Management Studio (SSMS) 16.
1. Creating new diagram
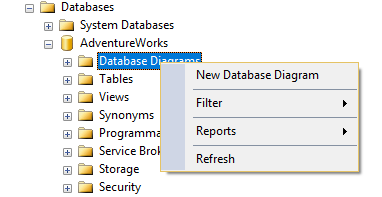
To create the new database diagram, you will need to right click on Database Diagrams folder and click on New Database Diagram.
If you crate diagram for the first time you may get the following message:
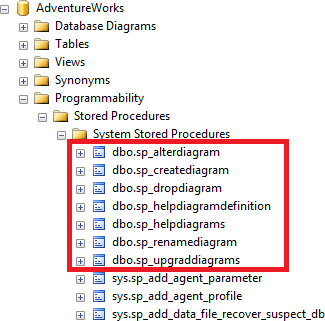
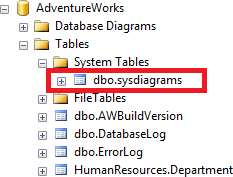
SSMS requires some system procedures and a table that are not created with the database. You need to confirm to create them. This will create following system procedures in your database:
dbo.sp_alterdiagram
dbo.sp_dropdiagram
dbo.sp_creatediagram
dbo.sp_renamediagram
dbo.sp_helpdiagramdefinition
dbo.sp_helpdigarms
dbo.sp_upgradediagrams
dbo.sysdiagrams
If the above message appears, you need to right click on Database Diagrams folder again and choose New Database Diagram option.
A window will appear with list of all the tables in your database. To add the tables to the diagram select them (use Control or Shift keys to select multiple at once) and click Add button or double click on them. When you add all required tables click Close button.
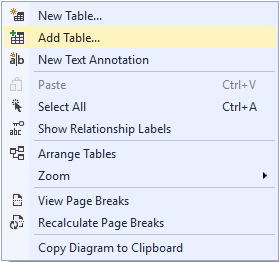
You can add tables later on. Just right click on diagram pane and choose Add Table.
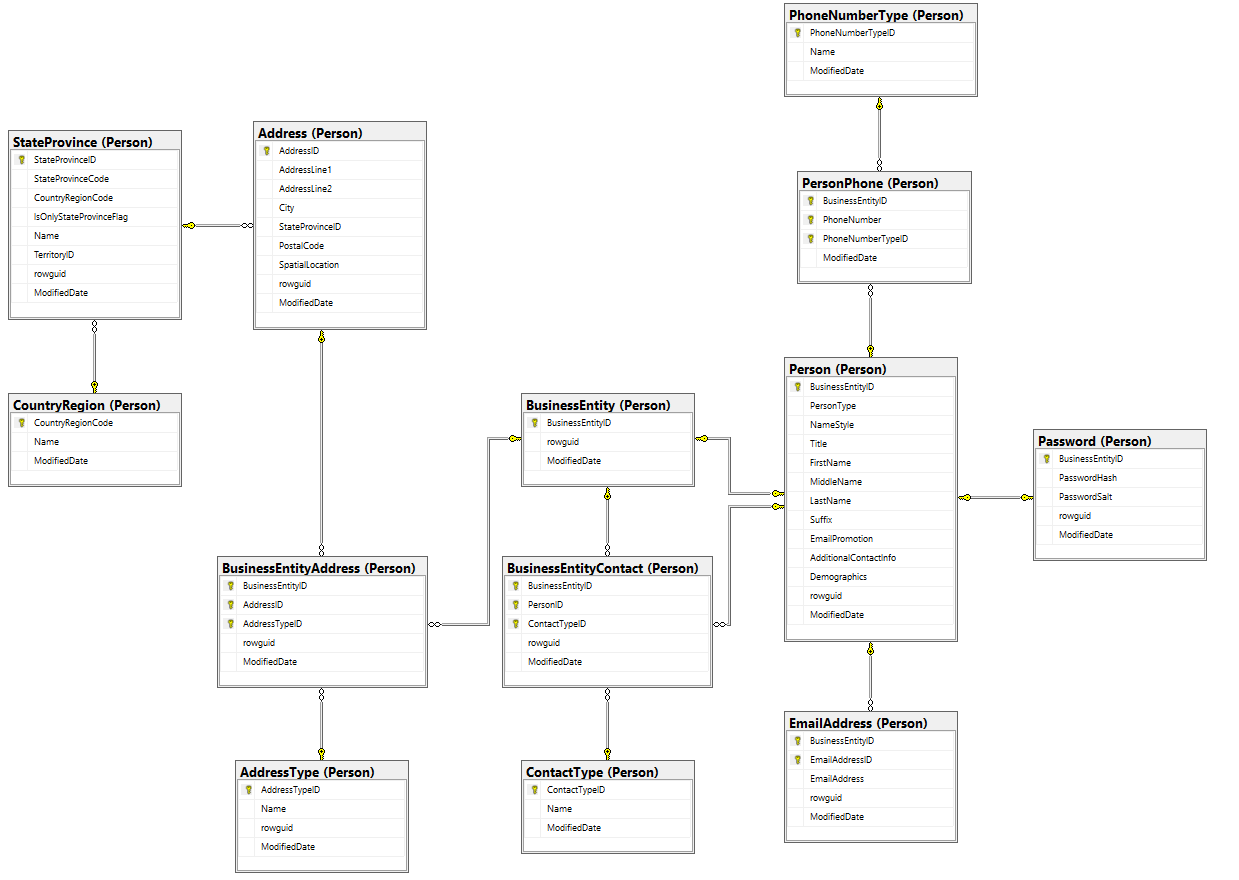
This will create a diagram with the tables columns, primary keys, and relationships that were read from the schema.
2. Tuning diagram
For now you have diagram with all the tables but it might not look like the way you want it. SSMS has a very useful function — Autosize. Select all tables (Ctrl + A), right click on one of them and click Autosize Selected Tables.
Tables will be arranged on the diagram. If you are not happy with the result, you can drag & drop them for better alignment.
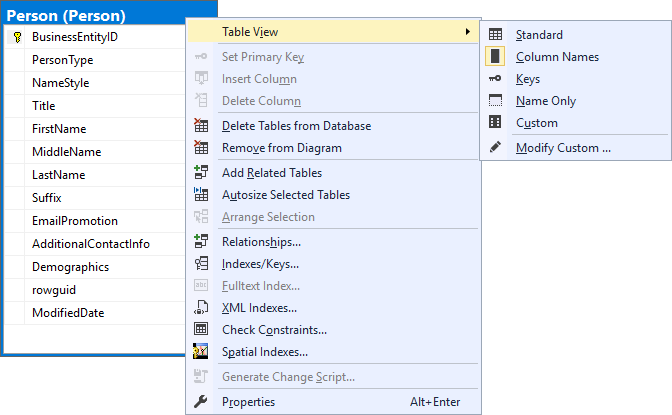
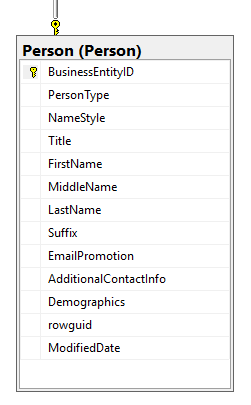
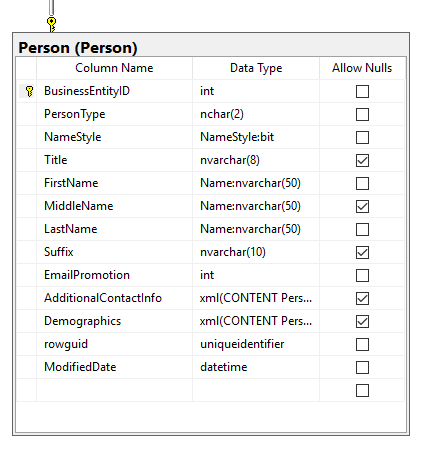
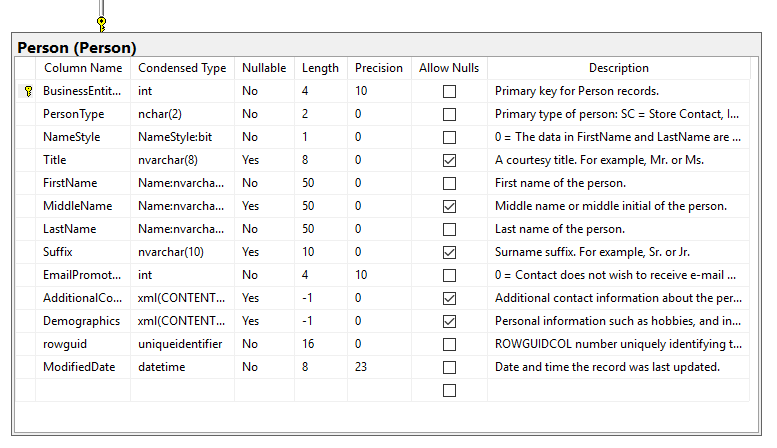
You can also decide how to display the tables. Right click on the table and choose one of the options in Table View.
Column names
This option shows column names and primary key only.
Standard
This option will include basic column attributes.
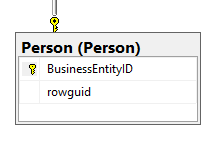
Keys
This option will include only columns that are part of a primary, unique or foreign key.
Name only
This option will show table names only.
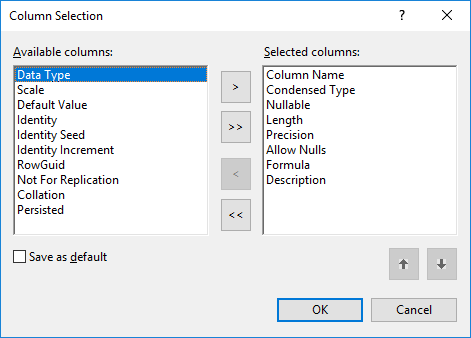
Custom
You can also create your custom view, where you can choose which column attributes you want to include.
After small updated my diagram looks like below:
3. Adding related tables
SSMS editor comes with one useful function. You can automatically add all the tables related to a particular table (with a foreign key relationship) to the diagram. To do it, right click on the table and choose Add Related Tables.
4. Adding relation labels
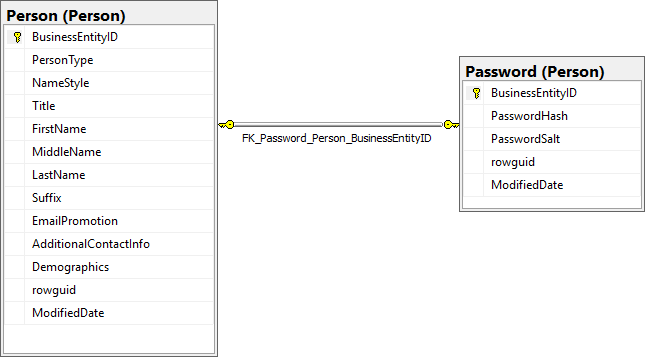
SSMS enables you to add labels to the relationships. This is always a name of the foreign key constraint. Nothing particularly useful, if you ask me.
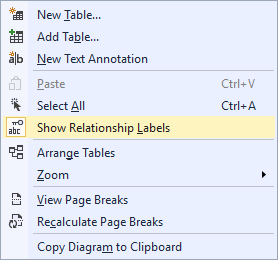
To add labels right click on diagram pane and choose Show Relationship Labels.
5. Adding annotations
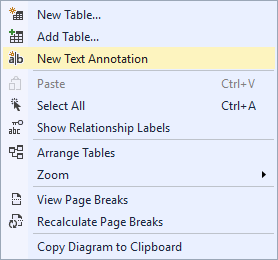
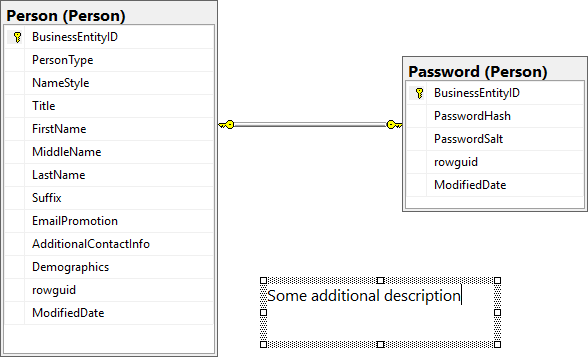
One useful option is the ability to add annotations to your diagram. To add the annotation right click on the pane and choose New Text Annotation.
This will create a blank text field where you can provide your notes and comments. This will always be visible and export with your diagram.
6. Saving diagram
You can save your diagram in the database (it will be saved in the dbo.sysdiagrams table you created earlier). To save diagram go to File -> Save Diagram_0 (this is default name for first diagram) or close the editor. You will be prompted with the diagram name. Provide a name and press OK.
7. Exporting diagram
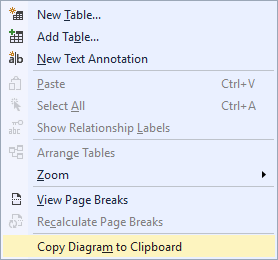
Management Studio enables you to export diagram to image. To convert it to the image, right click on the diagram pane and choose Copy Diagram to Clipboard. You can now paste it into graphic software or into a document.
8. Opening diagram
All the diagrams saved in the database are visible under Database Diagrams folder. To open a diagram, double click it or right click on it and choose Modify option.
Pros & cons of diagrams in SSMS
Pros
Ability to add multiple diagrams into a database
Keeping diagrams with database schema
Schema changes are automatically reflected on the diagram
Ability to add annotations
Ability to customize table display
In already tool that is used by DBAs and developers
Cons
Limited formatting capabilities
Unable to add views into diagram
Unable to show relationships that are not defined in as foreign key constraints
Requires access to the database
Another way: Dataedo
There is a better way to create and share diagrams of existing databases — Dataedo. Here is a sample export of complete database documentation:


 Jim Evans is an IT Manager currently for Crowe who has managed DBA, Developer, BI and Data Management teams for over 20 years.