SQL Server Database Diagram Tool in Management Studio
Often sophisticated tools such as ER/Studio or ERWIN are used to create database diagrams, but these are not necessary to create simple database diagrams, print them or convert to a Microsoft Word document or to PDF to save and share with your team. In this tip we will walk through how to create a database diagram using SQL Server Management Studio (SSMS).
Solution
Using Microsoft’s sample database WideWorldImporters, I will demonstrate creating a simple database diagram of a limited number of tables focusing on Invoice related tables in the database. I’ll then copy the Database Diagram to MS Word so it can be saved and printed.
Step 1 – New Database Diagram using SQL Server Management Studio
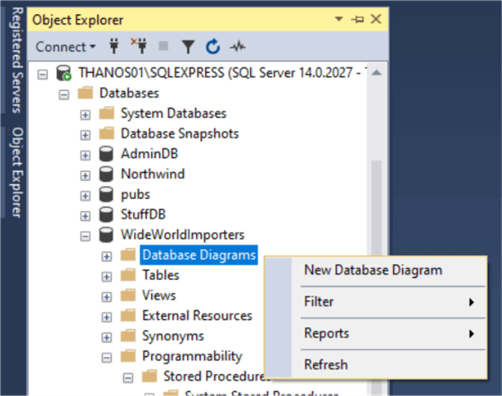
In SSMS under the database WideWorldImporters, right click «Database Diagrams» and select «New Database Diagram».
Step 2 – From Database Diagram – Select a table
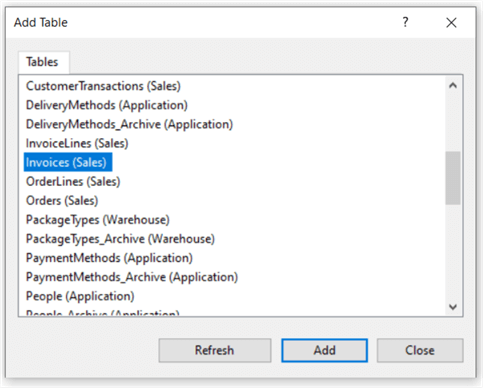
From the Database Diagrams tool dialog scroll and select Invoice table. Press Add and then Close.
Step 3 – From Database Diagram – Add Related tables
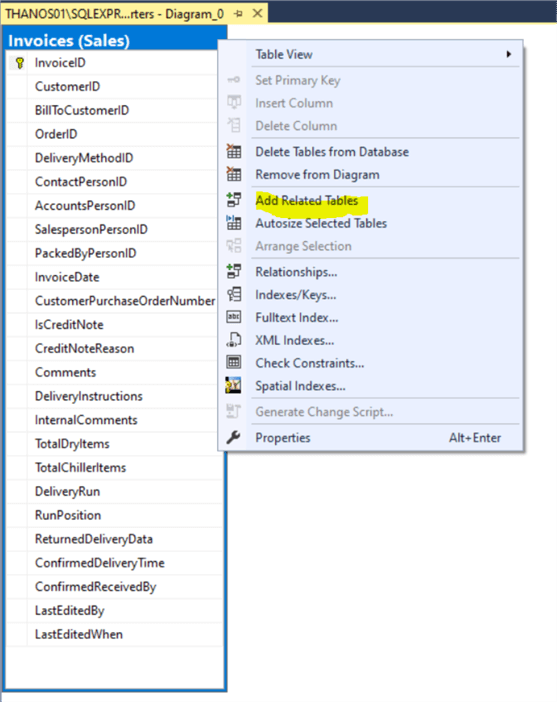
Right click the Invoices table and select «Add Related Tables«. This automatically adds tables linked to the Invoices table by Foreign Keys of which the Invoices table is a foreign key.
Step 4 – Eliminate Unwanted Tables from the Diagram
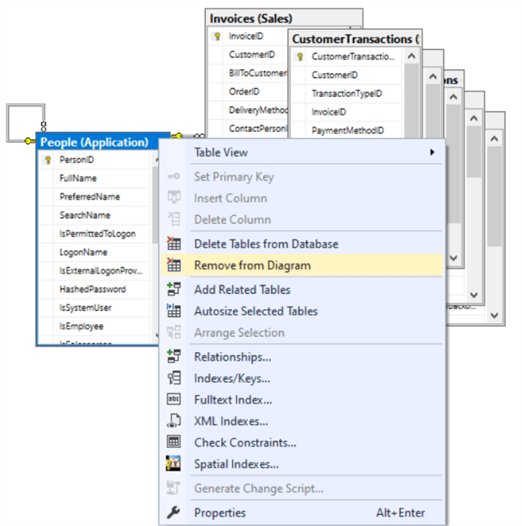
Right click on any table that might clutter the diagram and that you feel is not important and select «Remove From Diagram«.
Step 5 – From Database Diagram – Auto Arrange Tables
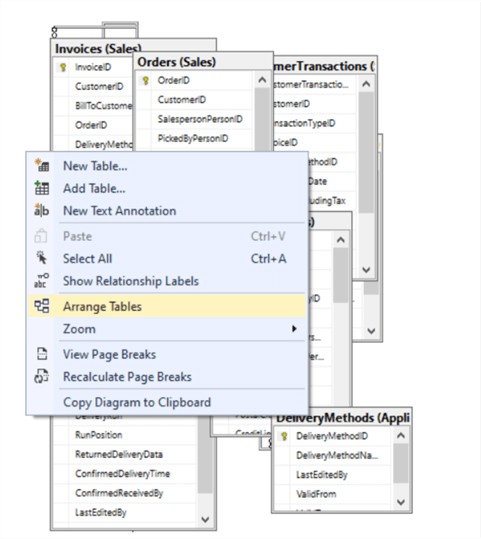
Right click the Invoices table and select «Arrange Tables«. This organizes the tables with out overlapping.
Step 6 – From Database Diagram – Adjust the Layout
You can do the following:
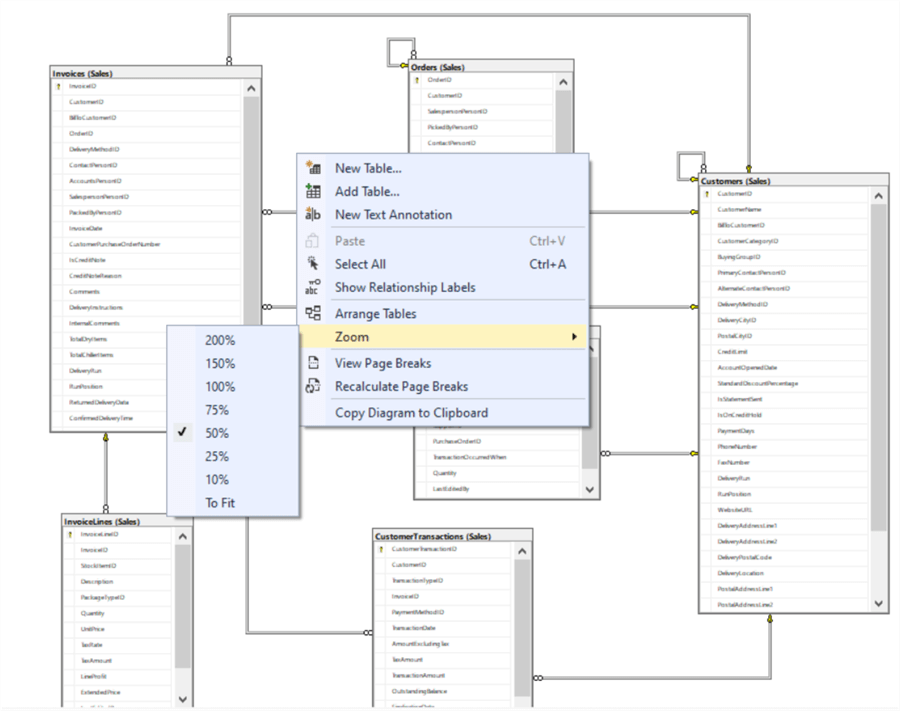
Right click to select a Zoom level to see your tables.
Drag a table to adjust the positioning.
Click a table and put the cursor on the edge to resize the table layout.
Step 7 – From Database Diagram – Auto Size All Tables
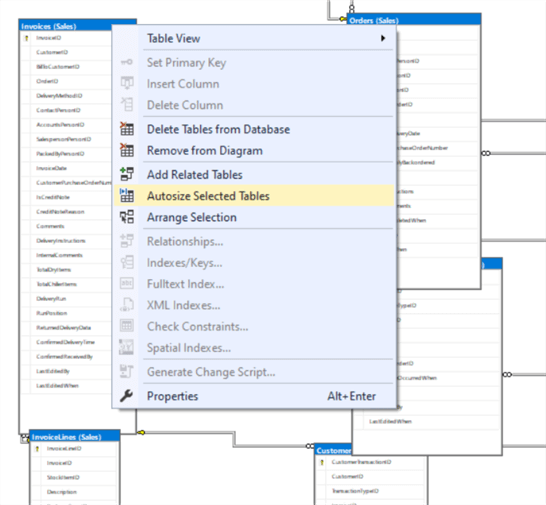
Use CTRL + A to select all tables. Right click any highlighted table and select «Autosize Selected Tables«. Select and drag the connector lines to rearrange.
Step 8 – From Database Diagram – Copy to Clipboard
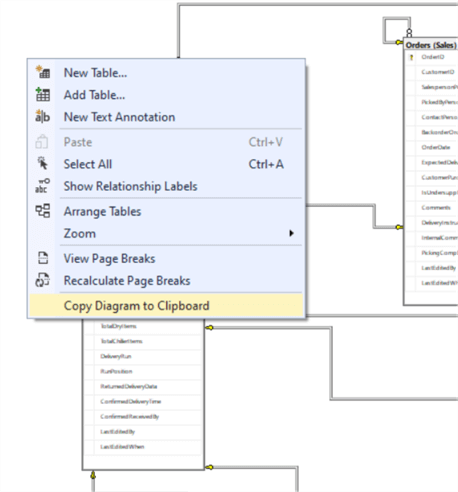
Once the Diagram is sized and arranged as desired, hit Save and give your Diagram a name. Then right click any white space in the Diagram and select «Copy Diagram to Clipboard«.
Step 9 – Paste the Diagram to MS Word
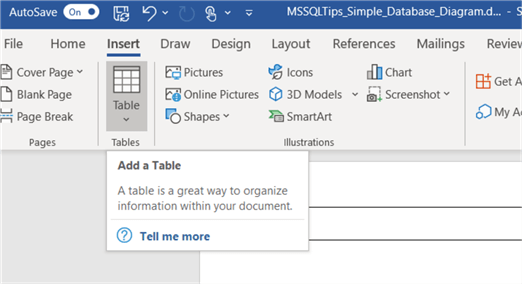
Open Microsoft Word. Insert a single cell Table and paste the Database Diagram in the cell.
Step 10 – In Word Adjust and Maximize the Database Diagram Image
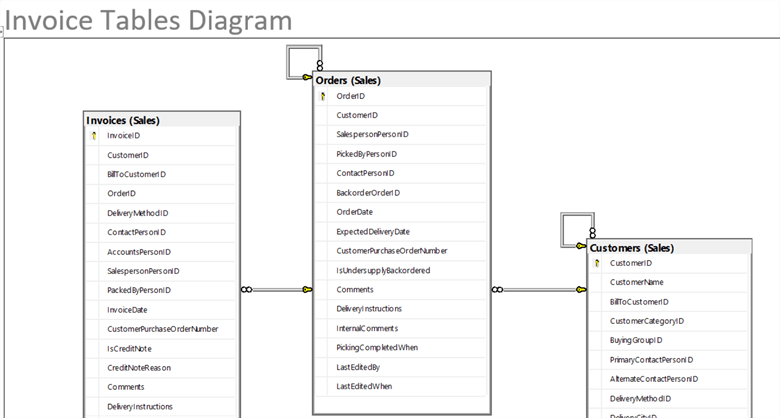
Adjust the Word document to maximize the database diagram image. Change the margins to .5 inch, enter the image and resize it to enlarge. Below is a snippet from a Word document Database Diagram.
Wrap Up
Once the diagram is in Word you can print it, share it, or save as a Word Doc or PDF file. This is an effective way to create simple limited Database Diagrams that can be leveraged when documenting your database. I find creating partial database diagrams around logical groups of tables a good way to document a database. There are other options that can be done in SSMS Database Diagrams such as only showing the Table Names and Relationships or only displaying the Key Columns which may allow more tables to be added to the Database Diagram and still fit in a Word document.
Next Steps
Also check out more on Reverse engineering a database
For addition details about SSMS Database Diagrams read Getting Started with SQL Server Database Diagrams
Learn more about Working with Database Diagrams from Microsoft SQL Docs
Check out these other articles for SQL Server Management Studio
About the author
Jim Evans is an IT Manager currently for Crowe who has managed DBA, Developer, BI and Data Management teams for over 20 years.
Article Last Updated: 2022-04-06
Comments For This Article
Thursday, August 11, 2022 — 4:07:55 PM — Izhar Azati
Back To Top (90371)
But there is a problem with printing from SSMS when there is also the «IS NULL» column. The problem has existed for several years. The checkbox print very large.
Sunday, October 18, 2020 — 5:32:34 PM — Amira Ali
Back To Top (86655)
Thank you so much, please keep up the good work!
Sunday, May 17, 2020 — 11:29:44 AM — Jim Evans
Back To Top (85681)
Hello Ali — Thanks for reviewing the article.
When in SQL Server Management Studio with your database diagram opened and created, right click the link between two tables and go to Properties. Expand «Tables and Columns Specifications» to see the Primary Key and Foreign Key column names.
Hope this helps,
I need to know which columns from two tables are in relation, i.e. which column from master is private key and which column from detail is foreign key, as sql server data diagram does not automatically point to these columns. how can I do that?
Thanks in advance
Thanks for the post Ray. It is good to point out that you can modify database schema using the Database Diagram tool. Personally I only use the Database Diagram tool to get a picture of what is there and not to design the database. Note, to create Database Diagram via SSMS you must be a member of the db_owner role. Being a member of the db_owner roles comes with great responsibilities and understanding and the need to be cautious to avoid unintended mistakes.
I have avoided the diagram feature for years, and discouraged my developers from using it also. Early on we had some bad experiences with folks making unintential (and unrecorded) changes to data bases. :).
Name already in use
PiRIS / articles / 5_1_1_1_erd_workbench.md
Go to file T
Go to line L
Copy path
Copy permalink
Open with Desktop
View raw
Copy raw contents Copy raw contents
Copy raw contents
Copy raw contents
Создание ER-диаграммы в среде MySQL Workbench
Давайте теперь поработаем с системой базы данных MyFlix Video Library, чтобы помочь понять концепцию ER-диаграмм. Мы будем использовать эту базу данных для всей практической работы в оставшейся части этого урока
MyFlix — это юридическое лицо, которое сдает в аренду фильмы своим членам. MyFlix хранит свои записи вручную. Теперь руководство хочет перейти на СУБД
Вспомним шаги по разработке диаграммы EER для базы данных:
Определить сущности и отношения, которые существуют между ними.
Каждая сущность, атрибут и отношение должны иметь соответствующие имена, которые могут быть легко понятны и нетехническим людям.
Отношения не должны быть связаны напрямую друг с другом. Отношения должны соединять сущности.
Каждый атрибут в данном объекте должен иметь уникальное имя.
Объекты, которые должны быть включены в нашу ER-диаграмму:
Участники — эта сущность будет хранить информацию об участниках.
Фильмы — эта сущность будет содержать информацию о фильмах
Категории — эта сущность будет содержать информацию, которая помещает фильмы в различные категории, такие как «Драма», «Действие», «Эпический» и т. Д.
Прокат фильмов — эта сущность будет хранить информацию о фильмах, сдаваемых в аренду ее членам.
Платежи — эта сущность будет хранить информацию о платежах, произведенных участниками.
Определение отношений между сущностями
Участники и фильмы
Участник может арендовать один или больше фильмов.
Фильм может быть арендован более чем одним участником.
Из приведенного выше сценария мы можем видеть, что нужно использовать отношение «многие ко многим». Реляционные базы данных не поддерживают отношения «многие ко многим». Нам нужно ввести новую сущность — таблицу связей. Эту роль будет играет таблица MovieRentals. Она имеет отношение один-ко-многим с таблицей участников и отношение один-ко-многим с таблицей фильмов.
Фильмы и категории лиц
Фильм может принадлежать только к одной категории, но в категории может быть несколько фильмов.
Из этого можно сделать вывод, что характер отношений между категориями и таблицей фильмов один-ко-многим.
Участники и платежные организации
Участник может иметь только одну учетную запись, но может сделать несколько платежей.
Из этого можно сделать вывод, что характер взаимоотношений между участниками и платежными организациями один-ко-многим.
Теперь давайте создадим модель EER, используя MySQL Workbench
Модель улучшенного отношения сущностей (EER)
Модель Enhanced Entity Relationship (EER) — это модель данных высокого уровня, которая предоставляет расширения для исходной модели Entity Relationship (ER). EER Models поддерживает более детальный дизайн. EER Modeling появилась как решение для моделирования очень сложных баз данных.
В рабочей среде MySQL Workbench перейдите в режим моделирования и нажмите кнопку «+»
Дважды щелкните кнопку Добавить диаграмму, чтобы открыть рабочее пространство для диаграмм ER.
Появляется окно EER Diagram
Давайте посмотрим на два типа объектов, с которыми мы будем работать.
Объект таблицы позволяет нам создавать объекты и определять атрибуты, связанные с конкретным объектом.
Кнопки отношений позволяет нам определять отношения между объектами.
Участники организации будет иметь следующие атрибуты
Членский номер
Полные имена
Пол
Дата рождения
Физический адрес
Почтовый адрес
Создадим таблицу участников:
Кликните по кнопке «Таблица»
В верхней части окна диаграммы появится запрос параметров для создаваемой таблицы:
В поле Collation Выбираем utf8mb4_0900_ai_ci и кликаем по области диаграммы — появится сущность с названием table1 (остальные параметры не меняем)
CI — Case Insensitive — без учета регистра;
CS — Case Sensitive — c учетом регистра;
AS — Accent Sensitive — с учетом аксонов или диакритических знаков, проще говоря ‘a’ не считается равным ‘ấ’.
AI — Accent Insensitive — без учета аксонов или диакритических знаков, проще говоря ‘е’ считается равным ‘ё’.
UTF8 — позволяет хранить данные в UTF8.
mb4 — минимальное количество байт для хранения символа utf (utf8 без суффикса mb4 использует 3 байта на символ, и в этот набор не входят, например, emoji)
bin — простое побитовое сравнение
Дважды кликните мышкой по этой сущности. Появится окно свойств, показанное ниже:
Задайте название сущности (поле Table Name) и добавьте атрибуты (Column Name)
Должно получиться примерно такое:
Повторите эти действия для всех сущностей, в итоге должно получиться примерно так:
Таблица связей названа по именам связываемых сущностей
В названиях сущностей и атрибутов используем CamelCase и единственное число
сразу создаем атрибуты для связей (PaymentId, MemberId, MovieId? CategoryId). В принципе MySQL Workbench может автоматически созавать эти атрибуты при создании связей, но при этом он называет их не по нашему стандарту.
Кликаем по иконке создания связи «один-ко-многим»
Затем последовательно кликаем по внешнему ключу MemberMovie.MemberId и Member.id (нужные поля подсвечиваются под курсором)
Повторяем эти действия для всех связей, в итоге получится примерно следующее:
ER-модель
ER-модель – это наглядное представление модели данных предметной области, на основе которой затем создается база данных (БД) системы.
Инструменты для визуализации ER-модели готовой БД
ER-модель готовой базы данных – физический уровень модели данных.
Если Вам необходимо подключиться к существующей IT-системе и посмотреть ER-модель, то я рекомендую воспользоваться одним из инструментов.
Все инструменты поддерживают подключение к 15+ видам БД:
Инструкция для DBeaver
Самый удобный инструмент, который довелось использовать для визуализации ER-диаграммы готовой БД, DBeaver.
Преимущества: �� регулярно обновляется, �� бесплатный, �� интуитивно понятный, �� поддерживает русский язык.
1. Подключитесь к БД. На скриншотах выделены те параметры, которые обычно нужно заполнить. Бывает, что нужны дополнительные средства для подключения к БД проекта (например, VPN).
PRE-NOTE (If you want to create an ERD fast then read this)
When I initially tried to create an ERD using pgAdmin 4 I clicked on the “New ERD Project” option in the Tools dropdown and it gave me a blank grid to work off of. Because of that I actually had to manually create each table, row, and constraint in the diagram and it took me hours. The next time I attempted to create an ERD I first right-clicked on the database I wanted to work with and instead chose “Generate ERD” and initially it still appeared that I had a blank ERD to start with but when I zoomed out I noticed that an ERD was already created for me and it included all of the accurate table names, row names, constraints and relationships. In the end what had previously taken me hours to complete now only took me 30 seconds.
That being said, I found it very useful to create my own ERD manually. It got me thinking about the process, the data types, constraints, and relationships in a way that I felt further solidified my knowledge of SQL.
PREREQUISITES
This tutorial assumes you already have PostgreSQL, pgAdmin 4, and The Pagila Database installed and set-up. If you need instructions on setting this up please visit my previous article: Simulating A Real-world SQL Environment.


 Jim Evans is an IT Manager currently for Crowe who has managed DBA, Developer, BI and Data Management teams for over 20 years.


