Логирование в Python: руководство разработчика
Сталкивались ли вы с трудностями при отладке Python-кода? Если это так — то изучение того, как наладить логирование (журналирование, logging) в Python, способно помочь вам упростить задачи, решаемые при отладке.

Если вы — новичок, то вы, наверняка, привыкли пользоваться командой print() , выводя с её помощью определённые значения в ходе работы программы, проверяя, работает ли код так, как от него ожидается. Использование print() вполне может оправдать себя при отладке маленьких Python-программ. Но, когда вы перейдёте к более крупным и сложным проектам, вам понадобится постоянный журнал, содержащий больше информации о поведении вашего кода, помогающий вам планомерно отлаживать и отслеживать ошибки.
Из этого учебного руководства вы узнаете о том, как настроить логирование в Python, используя встроенный модуль logging . Вы изучите основы логирования, особенности вывода в журналы значений переменных и исключений, разберётесь с настройкой собственных логгеров, с форматировщиками вывода и со многим другим.
Вы, кроме того, узнаете о том, как Sentry Python SDK способен помочь вам в мониторинге приложений и в упрощении рабочих процессов, связанных с отладкой кода. Платформа Sentry обладает нативной интеграцией со встроенным Python-модулем logging , и, кроме того, предоставляет подробную информацию об ошибках приложения и о проблемах с производительностью, которые в нём возникают.
Начало работы с Python-модулем logging
В Python имеется встроенный модуль logging , применяемый для решения задач логирования. Им мы будем пользоваться в этом руководстве. Первый шаг к профессиональному логированию вы можете выполнить прямо сейчас, импортировав этот модуль в своё рабочее окружение.
Встроенный модуль логирования Python даёт нам простой в использовании функционал и предусматривает пять уровней логирования. Чем выше уровень — тем серьёзнее неприятность, о которой сообщает соответствующая запись. Самый низкий уровень логирования — это debug (10) , а самый высокий — это critical (50) .
Дадим краткие характеристики уровней логирования:
Debug (10) : самый низкий уровень логирования, предназначенный для отладочных сообщений, для вывода диагностической информации о приложении.
Info (20) : этот уровень предназначен для вывода данных о фрагментах кода, работающих так, как ожидается.
Warning (30) : этот уровень логирования предусматривает вывод предупреждений, он применяется для записи сведений о событиях, на которые программист обычно обращает внимание. Такие события вполне могут привести к проблемам при работе приложения. Если явно не задать уровень логирования — по умолчанию используется именно warning .
Error (40) : этот уровень логирования предусматривает вывод сведений об ошибках — о том, что часть приложения работает не так как ожидается, о том, что программа не смогла правильно выполниться.
Critical (50) : этот уровень используется для вывода сведений об очень серьёзных ошибках, наличие которых угрожает нормальному функционированию всего приложения. Если не исправить такую ошибку — это может привести к тому, что приложение прекратит работу.
В следующем фрагменте кода показано использование вышеперечисленных уровней логирования при выводе нескольких сообщений. Здесь используется синтаксическая конструкция logging.<level>(<message>) .
Ниже приведён результат выполнения этого кода. Как видите, сообщения, выведенные с уровнями логирования warning , error и critical , попадают в консоль. А сообщения с уровнями debug и info — не попадают.
Это так из-за того, что в консоль выводятся лишь сообщения с уровнями от warning и выше. Но это можно изменить, настроив логгер и указав ему, что в консоль надо выводить сообщения, начиная с некоего, заданного вами, уровня логирования.
Подобный подход к логированию, когда данные выводятся в консоль, не особо лучше использования print() . На практике может понадобиться записывать логируемые сообщения в файл. Этот файл будет хранить данные и после того, как работа программы завершится. Такой файл можно использовать в качестве журнала отладки.
Обратите внимание на то, что в примере, который мы будем тут разбирать, весь код находится в файле main.py . Когда мы производим рефакторинг существующего кода или добавляем новые модули — мы сообщаем о том, в какой файл (имя которого построено по схеме <module-name>.py ) попадает новый код. Это поможет вам воспроизвести у себя то, о чём тут идёт речь.
Логирование в файл
Для того чтобы настроить простую систему логирования в файл — можно воспользоваться конструктором basicConfig() . Вот как это выглядит:
Поговорим о логгере root , рассмотрим параметры basicConfig() :
level : это — уровень, на котором нужно начинать логирование. Если он установлен в info — это значит, что все сообщения с уровнем debug игнорируются.
filename : этот параметр указывает на объект обработчика файла. Тут можно указать имя файла, в который нужно осуществлять логирование.
filemode : это — необязательный параметр, указывающий режим, в котором предполагается работать с файлом журнала, заданным параметром filename . Установка filemode в значение w (write, запись) приводит к тому, что логи перезаписываются при каждом запуске модуля. По умолчанию параметр filemode установлен в значение a (append, присоединение), то есть — в файл будут попадать записи из всех сеансов работы программы.
После выполнения модуля main можно будет увидеть, что в текущей рабочей директории был создан файл журнала, py_log.log .

В текущей рабочей директории был создан файл журнала py_log.log
Так как мы установили уровень логирования в значение info — в файл попадут записи с уровнем info и с более высокими уровнями.

Так как уровень логирования установлен в info, в файл, помимо сообщений уровня warning, error и critical, попадут и записи уровня info
Записи в лог-файле имеют формат <logging-level>:<name-of-the-logger>:<message> . По умолчанию <name-of-the-logger> , имя логгера, установлено в root , так как мы пока не настраивали пользовательские логгеры.
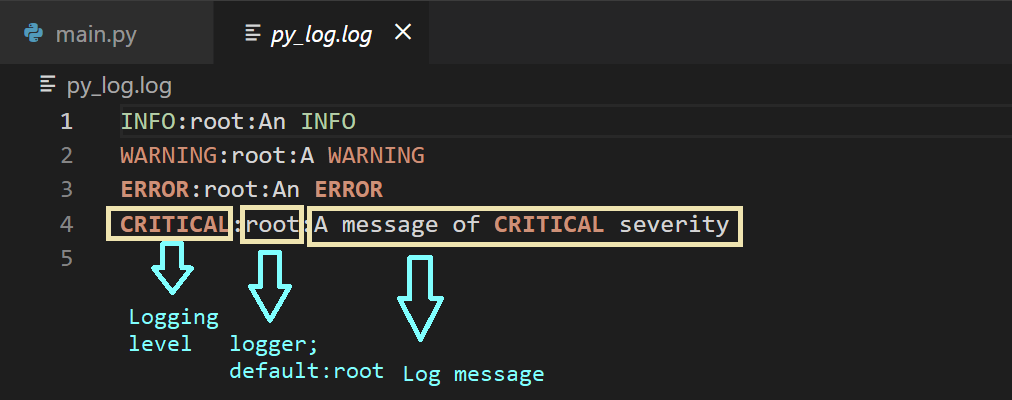
В записи лог-файла закодированы уровень логирования, имя логгера и сообщение
Помимо базовой информации, выводимой в лог, может понадобится снабдить записи отметками времени, указывающими на момент вывода той или иной записи. Это упрощает анализ логов. Сделать это можно, воспользовавшись параметром конструктора format :

Благодаря настройке параметра format к записям добавлены временные метки, представленные в виде, удобном для восприятия
Существуют и многие другие атрибуты записи лога, которыми можно воспользоваться для того чтобы настроить внешний вид сообщений в лог-файле. Настраивая поведение логгера root — так, как это показано выше, проследите за тем, чтобы конструктор logging.basicConfig() вызывался бы лишь один раз. Обычно это делается в начале программы, до использования команд логирования. Последующие вызовы конструктора ничего не изменят — если только не установить параметр force в значение True .
Логирование значений переменных и исключений
Модифицируем файл main.py . Скажем — тут будут две переменных — x и y , и нам нужно вычислить значение выражения x/y . Мы знаем о том, что при y=0 мы столкнёмся с ошибкой ZeroDivisionError . Обработать эту ошибку можно в виде исключения с использованием блока try/except .
Далее — нужно залогировать исключение вместе с данными трассировки стека. Чтобы это сделать — можно воспользоваться logging.error(message, exc_info=True) . Запустите следующий код и посмотрите на то, как в файл попадают записи с уровнем логирования info , указывающие на то, что код работает так, как ожидается.

В файл журнала попали записи с уровнем логирования info
Теперь установите значение y в 0 и снова запустите модуль.
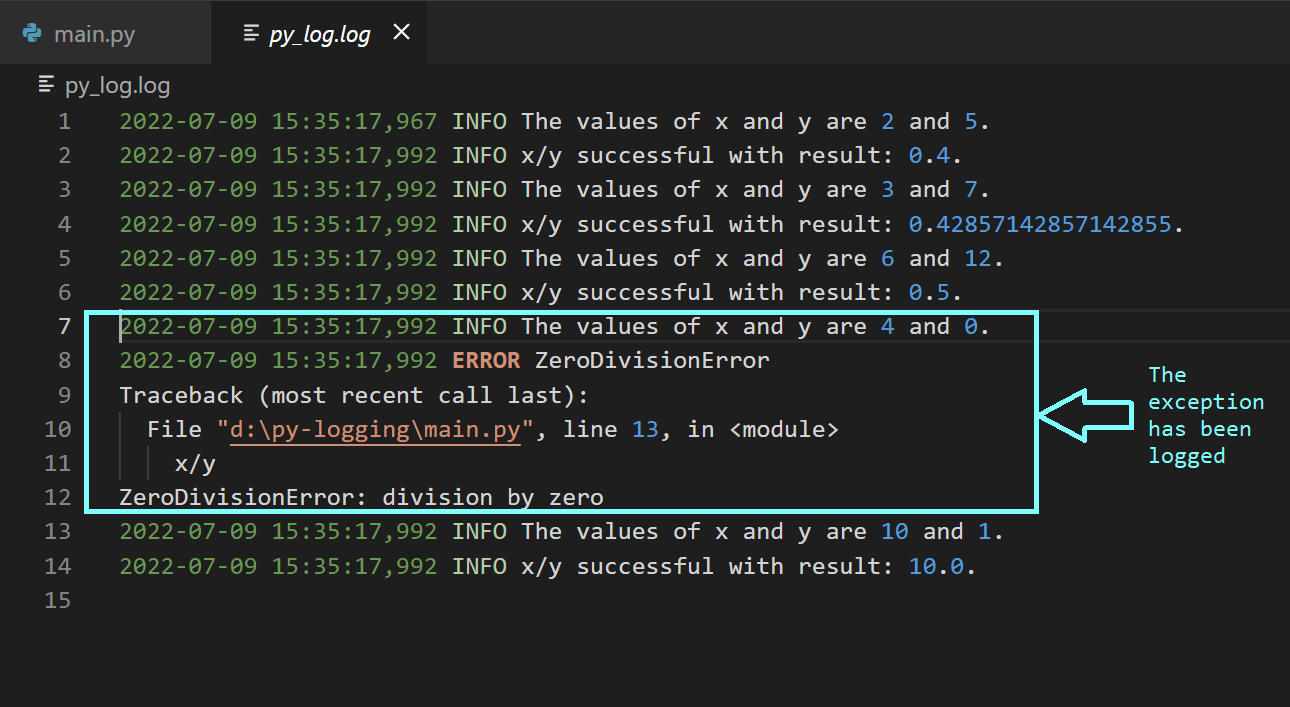
Исследуя лог-файл py_log.log , вы увидите, что сведения об исключении были записаны в него вместе со стек-трейсом.

В журнале появилась запись об ошибке вместе с результатами трассировки стека
Теперь модифицируем код так, чтобы в нём имелись бы списки значений x и y , для которых нужно вычислить коэффициенты x/y . Для логирования исключений ещё можно воспользоваться конструкцией logging.exception(<message>) .
Сразу после запуска этого кода можно будет увидеть, что в лог-файл попала информация и о событиях успешного вычисления коэффициента, и об ошибке, когда возникло исключение.
Записи об успешных попытках вычисления коэффициента и об исключении
Настройка логирования с помощью пользовательских логгеров, обработчиков и форматировщиков
Отрефакторим код, который у нас уже есть. Объявим функцию test_division .
Объявление этой функции находится в модуле test_div . В модуле main будут лишь вызовы функций. Настроим пользовательские логгеры в модулях main и test_div , проиллюстрировав это примерами кода.
Настройка пользовательского логгера для модуля test_div
Настройка пользовательского логгера для модуля main
Разберёмся с тем, что происходит коде, где настраиваются пользовательские логгеры.
Сначала мы получаем логгер и задаём уровень логирования. Команда logging.getLogger(name) возвращает логгер с заданным именем в том случае, если он существует. В противном случае она создаёт логгер с заданным именем. На практике имя логгера устанавливают с использованием специальной переменной name , которая соответствует имени модуля. Мы назначаем объект логгера переменной. Затем мы, используя команду logging.setLevel(level) , устанавливаем нужный нам уровень логирования.
Далее мы настраиваем обработчик. Так как мы хотим записывать сведения о событиях в файл, мы пользуемся FileHandler . Конструкция logging.FileHandler(filename) возвращает объект обработчика файла. Помимо имени лог-файла, можно, что необязательно, задать режим работы с этим файлом. В данном примере режим ( mode ) установлен в значение write . Есть и другие обработчики, например — StreamHandler , HTTPHandler , SMTPHandler .
Затем мы создаём объект форматировщика, используя конструкцию logging.Formatter(format) . В этом примере мы помещаем имя логгера (строку) в начале форматной строки, а потом идёт то, чем мы уже пользовались ранее при оформлении сообщений.
Потом мы добавляем форматировщик к обработчику, пользуясь конструкцией вида <handler>.setFormatter(<formatter>) . А в итоге добавляем обработчик к объекту логгера, пользуясь конструкцией <logger>.addHandler(<handler>) .
Теперь можно запустить модуль main и исследовать сгенерированные лог-файлы.
 Лог-файл main.log
 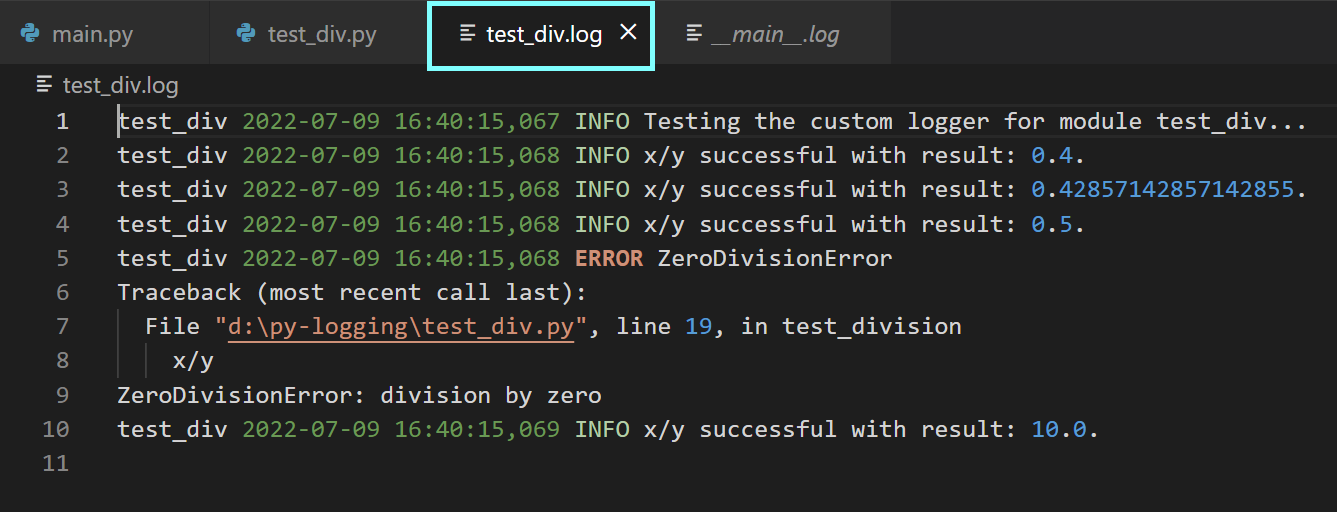 Лог-файл test_div.log
Рекомендации по организации логирования в Python
До сих пор мы говорили о том, как логировать значения переменных и исключения, как настраивать пользовательские логгеры. Теперь же предлагаю вашему вниманию рекомендации по логированию.
Устанавливайте оптимальный уровень логирования. Логи полезны лишь тогда, когда их можно использовать для отслеживания важных ошибок, которые нужно исправлять. Подберите такой уровень логирования, который соответствует специфике конкретного приложения. Вывод в лог сообщений о слишком большом количестве событий может быть, с точки зрения отладки, не самой удачной стратегией. Дело в том, что при таком подходе возникнут сложности с фильтрацией логов при поиске ошибок, которым нужно немедленно уделить внимание.
Конфигурируйте логгеры на уровне модуля. Когда вы работаете над приложением, состоящим из множества модулей — вам стоит задуматься о том, чтобы настроить свой логгер для каждого модуля. Установка имени логгера в name помогает идентифицировать модуль приложения, в котором имеются проблемы, нуждающиеся в решении.
Включайте в состав сообщений логов отметку времени и обеспечьте единообразное форматирование сообщений. Всегда включайте в сообщения логов отметки времени, так как они полезны в деле поиска того момента, когда произошла ошибка. Единообразно форматируйте сообщения логов, придерживаясь одного и того же подхода в разных модулях.
Применяйте ротацию лог-файлов ради упрощения отладки. При работе над большим приложением, в состав которого входит несколько модулей, вы, вполне вероятно, столкнётесь с тем, что размер ваших лог-файлов окажется очень большим. Очень длинные логи сложно просматривать в поисках ошибок. Поэтому стоит подумать о ротации лог-файлов. Сделать это можно, воспользовавшись обработчиком RotatingFileHandler , применив конструкцию, которая строится по следующей схеме: logging.handlers.RotatingFileHandler(filename, maxBytes, backupCount) . Когда размер текущего лог-файла достигнет размера maxBytes , следующие записи будут попадать в другие файлы, количество которых зависит от значения параметра backupCount . Если установить этот параметр в значение K — у вас будет K файлов журнала.
Сильные и слабые стороны логирования
Теперь, когда мы разобрались с основами логирования в Python, поговорим о сильных и слабых сторонах этого механизма.
Мы уже видели, как логирование позволяет поддерживать файлы журналов для различных модулей, из которых состоит приложение. Мы, кроме того, можем конфигурировать подсистему логирования и подстраивать её под свои нужды. Но эта система не лишена недостатков. Даже когда уровень логирования устанавливают в значение warning , или в любое значение, которое выше warning , размеры лог-файлов способны быстро увеличиваться. Происходит это в том случае, когда в один и тот же журнал пишут данные, полученные после нескольких сеансов работы с приложением. В результате использование лог-файлов для отладки программ превращается в нетривиальную задачу.
Кроме того, исследование логов ошибок — это сложно, особенно в том случае, если сообщения об ошибках не содержат достаточных сведений о контекстах, в которых происходят ошибки. Когда выполняют команду logging.error(message) , не устанавливая при этом exc_info в True , сложно обнаружить и исследовать первопричину ошибки в том случае, если сообщение об ошибке не слишком информативно.
В то время как логирование даёт диагностическую информацию, сообщает о том, что в приложении нужно исправить, инструменты для мониторинга приложений, вроде Sentry, могут предоставить более детальную информацию, которая способна помочь в диагностике приложения и в исправлении проблем с производительностью.
В следующем разделе мы поговорим о том, как интегрировать в Python-проект поддержку Sentry, что позволит упростить процесс отладки кода.
Интеграция Sentry в Python-проект
Установить Sentry Python SDK можно, воспользовавшись менеджером пакетов pip .
После установки SDK для настройки мониторинга приложения нужно воспользоваться таким кодом:
Как можно видеть — вам, для настройки мониторинга, понадобится ключ dsn . DSN расшифровывается как Data Source Name (имя источника данных). Найти этот ключ можно, перейдя в Your-Project > Settings > Client Keys (DSN) .
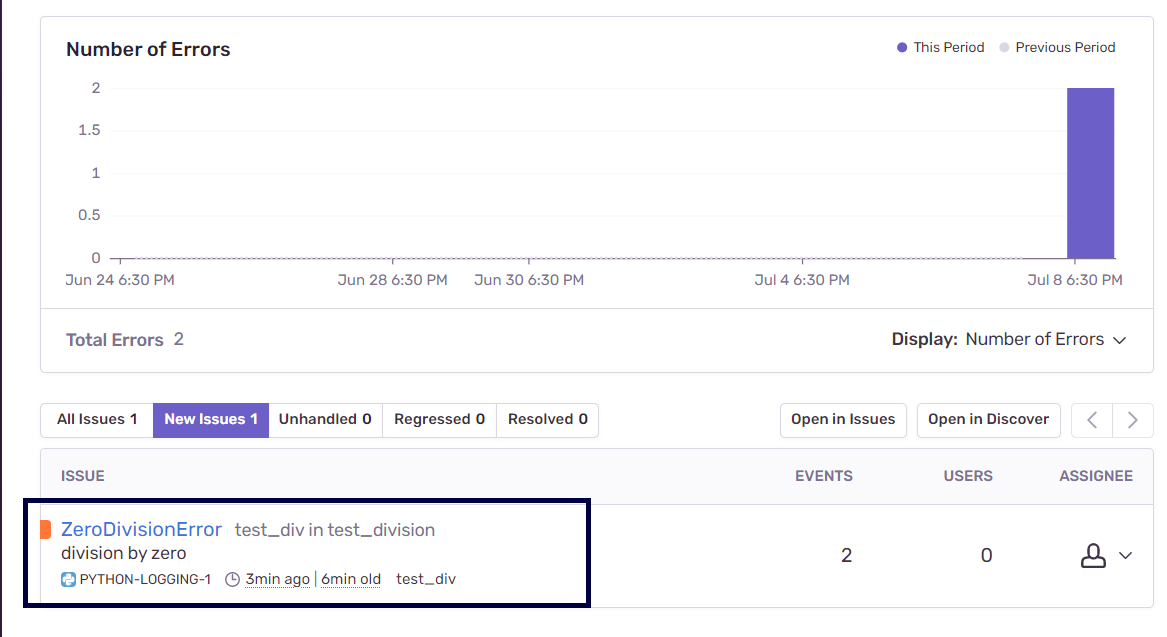
После того, как вы запустите Python-приложение, вы можете перейти на Sentry.io и открыть панель управления проекта. Там должны быть сведения о залогированных ошибках и о других проблемах приложения. В нашем примере можно видеть сообщение об исключении, соответствующем ошибке ZeroDivisionError .
Логи в интерфейсе Sentry.io
Изучая подробности об ошибке, вы можете увидеть, что Sentry предоставляет подробную информацию о том, где именно произошла ошибка, а так же — об аргументах x и y , работа с которыми привела к появлению исключения.
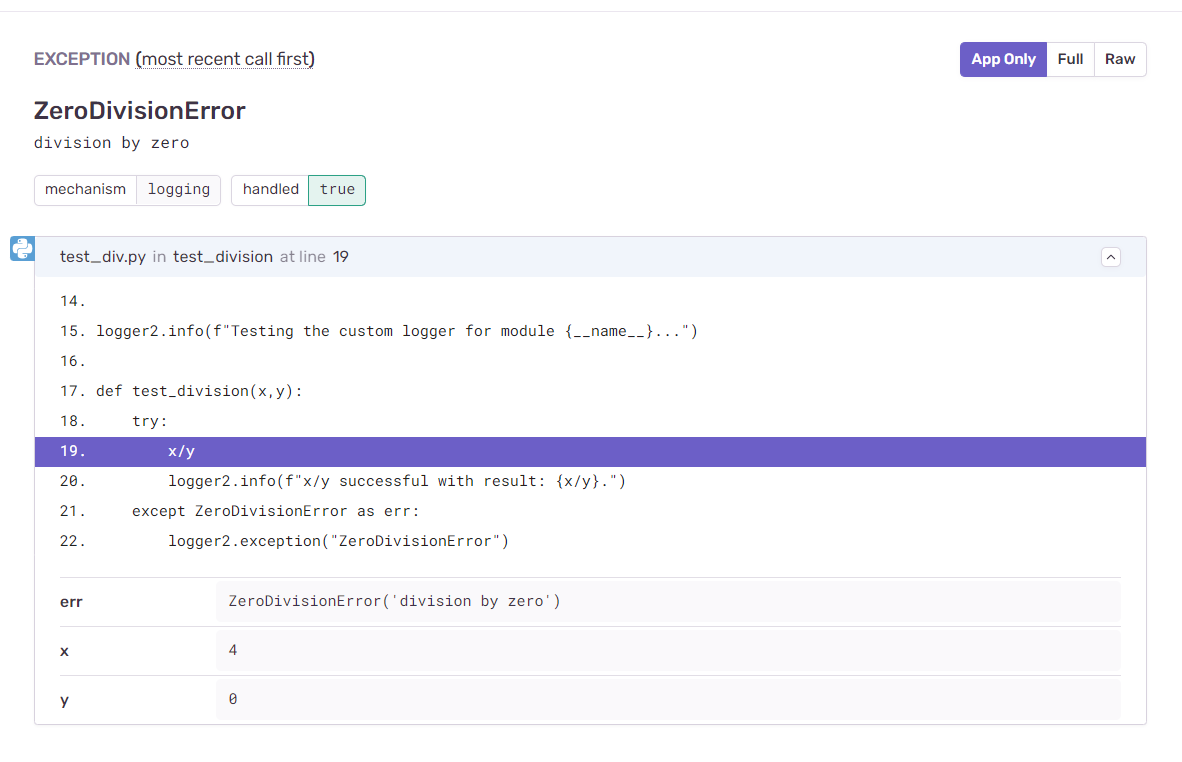
Подробные сведения об исключении
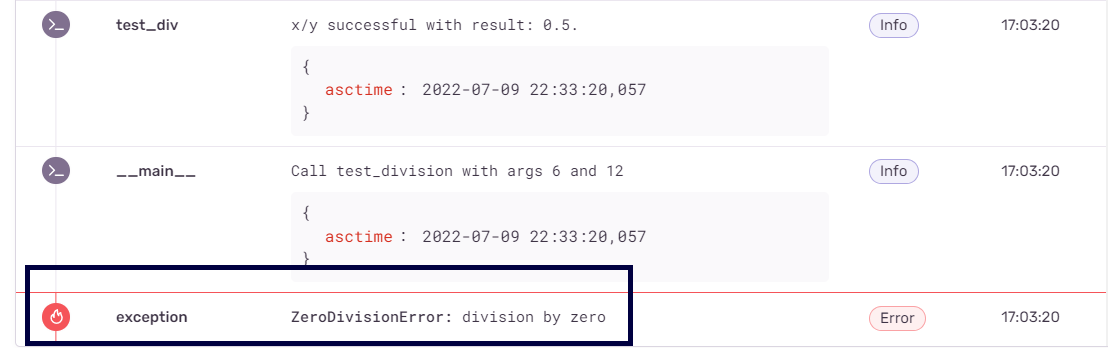
Продолжая изучение логов, можно увидеть, помимо записей уровня error , записи уровня info . Налаживая мониторинг приложения с использованием Sentry, нужно учитывать, что эта платформа интегрирована с модулем logging . Вспомните — в нашем экспериментальном проекте уровень логирования был установлен в значение info . В результате Sentry записывает все события, уровень которых соответствует info и более высоким уровням, делая это в стиле «навигационной цепочки», что упрощает отслеживание ошибок.
Sentry позволяет фильтровать записи по уровням логирования, таким, как info и error . Это удобнее, чем просмотр больших лог-файлов в поиске потенциальных ошибок и сопутствующих сведений. Это позволяет назначать решению проблем приоритеты, зависящие от серьёзности этих проблем, и, кроме того, позволяет, используя навигационные цепочки, находить источники неполадок.

Фильтрация записей по уровням логирования
В данном примере мы рассматриваем ZeroDivisionError как исключение. В более крупных проектах, даже если мы не реализуем подобный механизм обработки исключений, Sentry автоматически предоставит диагностическую информацию о наличии необработанных исключений. С помощью Sentry, кроме того, можно анализировать проблемы с производительностью кода.
Сведения о проекте
Код, использованный в данном руководстве, можно найти в этом GitHub-репозитории.
Итоги
Освоив это руководство, вы узнали о том, как настраивать логирование с использованием стандартного Python-модуля logging . Вы освоили основы настройки логгера root и пользовательских логгеров, ознакомились с рекомендациями по логированию. Вы, кроме того, узнали о том, как платформа Sentry может помочь вам в деле мониторинга ваших приложений, обеспечивая вас сведениями о проблемах с производительностью и о других ошибках, и используя при этом все возможности модуля logging .
Когда вы будете работать над своим следующим Python-проектом — не забудьте реализовать в нём механизмы логирования. И можете испытать бесплатную пробную версию Sentry.
О, а приходите к нам работать? �� ��
Мы в wunderfund.io занимаемся высокочастотной алготорговлей с 2014 года. Высокочастотная торговля — это непрерывное соревнование лучших программистов и математиков всего мира. Присоединившись к нам, вы станете частью этой увлекательной схватки.
Мы предлагаем интересные и сложные задачи по анализу данных и low latency разработке для увлеченных исследователей и программистов. Гибкий график и никакой бюрократии, решения быстро принимаются и воплощаются в жизнь.
Введение
![]()
Встроенный в Python модуль логирования разработан для того, чтобы дать вам детальное представление о приложениях с минимальными настройками. Начинаете ли вы работу или уже работаете, в руководстве вы увидите, как настроить этот модуль, чтобы помочь найти нужную строку кода.
В этом посте мы покажем вам, как:
- Настроить приоритет и расположение журналов.
Создать пользовательские настройки, включающие несколько логгеров и адресатов. - Добавить трассировку исключений в логи.
- Отформатировать логи в JSON и централизовать их.
Основы
Модуль logging включен в стандартную библиотеку Python. Метод basicConfig() — самый быстрый способ настройки. Тем не менее в документации рекомендуется создавать логгер для каждого модуля приложения, а значит, может быть сложно конфигурировать логгер для каждого модуля, используя только basicConfig() . Поэтому большинство приложений (включая веб-фреймворки, например, Django) автоматически ведут журналы на основе файлов или словаря. Если вы хотите начать с одного из этих методов, мы рекомендуем сразу перейти к нужному разделу.
У basicConfig() три основных параметра:
- level: минимальный уровень логирования. Доступны уровни: DEBUG , INFO , WARNING , ERROR и CRITICAL . Уровень по умолчанию — WARNING, то есть фильтруются сообщения уровней DEBUG и INFO .
- handler: определяет, куда направить логи. Если не указано иное, используется StreamHandler для направления сообщений в sys.stderr .
- format: формат, по умолчанию он такой:
В следующем разделе мы покажем, как настроить его, чтобы включить метки времени и другую полезную информацию.
Поскольку по умолчанию пишутся только журналы WARNING и более высокого уровня, вам может не хватать логов с низким приоритетом. Кроме того, вместо StreamHandler или SocketHandler для потоковой передачи непосредственно на консоль или во внешнюю службу по сети, вам лучше использовать FileHandler , чтобы писать в один или несколько файлов на диске.
Если при передаче по сети возникнут проблемы, то у вас не будет свободного доступа к этим логам: они будут храниться на каждом сервере локально. Логирование в файл позволяет создавать разные типы логов и объединять их службой мониторинга.
Базовый пример
В следующем примере используется basicConfig() , чтобы сконфигурировать приложение для логирования DEBUG и выше на диск, и указывается на наличие даты, времени и серьёзности в строке лога:
Если на входе будет недоступный файл, в лог запишется это:
Благодаря новой конфигурации сообщения отладки не фильтруются и, кроме сообщения об ошибке, дают информацию о дате, местном времени и уровне важности:
- %(asctime)s : дата и местное время.
- %(levelname)s : уровень.
- %(message)s : сообщение.
Здесь информация о стандартных атрибутах. В примере выше логирование не включает трассировку, затрудняя определение источника проблемы. Ниже мы покажем логирование трассировки исключений.
Подробности
Что делать, когда приложение разрастается? Вам нужна надёжная, масштабируемая конфигурация и имя логгера как часть каждого лога. В этой части мы:
- Настроим множественное логирование с отображением имени лога.
- Используем fileConfig , чтобы реализовать пользовательское логирование и роутинг.
- Запишем в лог трассировку и необработанные исключения.
Конфигурирование
Следуя лучшим практикам, используем метод получения имени лога модуля:
__name__ ссылается на полное имя модуля, из которого вызван метод getLogger . Это вносит ясность. Например, приложение включает lowermodule.py , вызываемый из uppermodule.py . Тогда getLogger(__name__) выведет имя ассоциированного модуля. Пример с форматом лога, включающим его имя:
Последовательный запуск uppermodule.py для существующего и не существующего файлов даст такой вывод:
Имя модуля логгера следует сразу за временной меткой. Если вы не использовали getLogger , имя модуля отображается как root , затрудняя определение источника. uppermodule.py отображается как __main__ (основной) потому, что это модуль верхнего уровня.
Сейчас два лога настраиваются двумя вызовами basicConfig . Далее мы покажем, как настроить множество логов с одним вызовом fileConfig.
fileConfig
fileConfig и dictConfig позволяют реализовать более гибкое логирование на основе файлов или словаря. Оно используется в Django и Flask. В файле конфигурации должны быть три секции:
- [loggers] — имена логгеров.
- [handlers] — типы обработчиков: fileHandler , consoleHander .
- [formatters] — форматы логов.
Каждая секция должна иметь списки. Уточняющие секции ключей (например, для определённого типа обработчика) должны иметь такой формат: [<ИМЯ_СЕКЦИИ>_<ИМЯ_КЛЮЧА>] . Файл logging.ini может выглядеть так:
Документация рекомендует прикреплять каждый обработчик к одному логу, прописывать основные настройки в корневом (root) логе и уточнять их в дочерних, а не дублировать одно и то же в дочерних логах. Подробнее в документации. В этом примере мы указали в root настройки для обоих логов, что избавило нас от дублирования кода.
Вместо logging.basicConfig(level=logging.DEBUG, format=’%(asctime)s %(name)s %(levelname)s:%(message)s’) в каждом модуле мы можем сделать так:
Этот код отключает существующие не корневые логгеры, включенные по умолчанию. Не забудьте импортировать logging.config . Кроме того, посмотрите в документацию логирования на основе словаря.
Логирование исключений
Чтобы logging.error перехватывала трассировку, установите sys.exc_info в True . Ниже пример с включенным и отключенным параметром:
Вывод для несуществующего файла:
Первая строка — вывод без трассировки, вторая и далее — с трассировкой. Кроме того, с помощью logger.exception вы можете логировать определённое исключение без дополнительных вмешательств в код.
Перехват необработанных исключений
Вы не можете предвидеть и обработать все исключения, но можете логировать необработанные исключения, чтобы исследовать их позже.
Необработанное исключение возникает вне try. except или, когда вы не включаете нужный тип исключения в except . Например, если приложение обнаруживает TypeError , а ваш except обрабатывает только NameError , исключение передаётся в другие try , пока не встретит нужный тип.
Если ничего не встретилось, исключение становится необработанным. Интерпретатор вызывает sys.excepthook с тремя аргументами: класс исключения, его экземпляр и трассировка. Эта информация обычно появляется в sys.stderr , но если вы настроили свой лог для вывода в файл, traceback не логируется.
Вы можете использовать стандартную библиотеку traceback для форматирования трассировки и её включения в лог. Перепишем word_count() так, чтобы она пыталась записать количество слов в файл. Неверное число аргументов в write() вызовет исключение:
При выполнении этого кода возникнет TypeError , не обрабатываемое в try-except . Однако оно логируется благодаря коду, включенному во второе выражение except :
Логирование трассировки обеспечивает критическую видимость ошибок в реальном времени. Вы можете исследовать, когда и почему они произошли.
Многострочные исключения легко читаются, но если вы объединяете свои журналы с внешним сервисом, то далее можно преобразовать их в JSON, чтобы гарантировать корректный анализ. Теперь мы покажем, как использовать для этого python-json-logger .
Унификация
В этом разделе мы покажем, как форматировать журналы в JSON, добавлять пользовательские атрибуты, а также централизовывать и анализировать данные.
Логирование в JSON
Со временем поиск лога станет сложной задачей, особенно если логи распределены между серверами, сервисами и файлами. Если вы централизовали логи с помощью, то будете знать, где искать, а не входить вручную на каждый сервер.
JSON — лучшая практика для централизации с помощью сервиса управления: компьютеры легко анализируют этот стандартный структурированный формат. В JSON логах легко обращаться с атрибутами: не нужно обновлять конвейеры обработки при их добавлении или удалении.
Сообщество Python разработало библиотеки, конвертирующие логи в JSON. Используем python-json-logger . Установка:
Теперь обновите файл конфигурации для настройки существующего модуля форматирования или добавления нового, ( [formatter_json] в примере ниже). Он должен использовать pythonjsonlogger.jsonlogger.JsonFormatter . В разделе format можно указать атрибуты, необходимые каждой записи:
Консольные логи по-прежнему соответствуют simpleFormatter для удобства чтения, но логи, созданные логгером lowermodule , теперь пишутся в JSON.
При включении pythonjsonlogger.jsonlogger.JsonFormatter в конфигурацию функция fileConfig() должна иметь возможность создавать JsonFormatter , пока выполняется код из среды, где импортируется pythonjsonlogger .
Если вы не используете файловую конфигурацию, нужно импортировать python-json-logger , а также определить обработчик и модуль форматирования, как описано в документации:
Почему JSON предпочтительнее, особенно когда речь идёт о сложных или подробных записях? Вернёмся к примеру многострочной трассировки:
Этот лог легко читать в файле или в консоли. Но если он обрабатывается платформой управления и правила многострочного агрегирования не настроены, то каждая строка может отображаться как отдельный лог. Это затруднит точное восстановление событий. Теперь, когда мы логируем трассировку исключений в JSON, приложение создаёт единый журнал:
Сервис логирования может легко интерпретировать этот JSON и показать всю информацию о трассировке, включая exc_info :
Пользовательские атрибуты
Еще одно преимущество — добавления атрибутов, анализируемых внешним сервисом управления автоматически. Ранее мы настроили format для стандартных атрибутов. Можно логировать пользовательские атрибуты, используя поле python-json-logs . Ниже мы создали атрибут, отслеживающий продолжительность операции в секундах:
В системе управления атрибуты анализируются так:
Если вы используете платформу мониторинга, то можете построить график и предупредить о большом run_duration . Вы также можете экспортировать этот график на панель мониторинга, когда захотите визуализировать его рядом с производительностью:
Используете вы python-json-logger или другую библиотеку для форматирования, вы можете легко настроить логи для включения информации, анализируемой внешней платформой управления.
Логи и другие источники данных
После такой централизации вы можете начать изучать логи вместе с распределенными трассировками запросов и метриками инфраструктуры. Такие службы, как Datadog, могут соединять журналы с метриками и данными мониторинга производительности, чтобы помочь вам увидеть полную картину.
Если вы обновите формат для включения dd.trace_iddd.span_id , система управления автоматически сопоставит журналы и трассировки каждого запроса. Это означает, что при просмотре трассировки вы можете просто щелкнуть вкладку “логи” в представлении трассировки, чтобы просмотреть все логи, созданные во время конкретного запроса:
Можно перемещаться в другом направлении: от журнала к трассировке создавшего журнал запроса. Смотрите нашу документацию для получения более подробной информации об автоматической корреляции логов и трассировок для быстрого устранения неполадок.
Заключение
Мы рассмотрели рекомендации по настройке стандартной библиотеки логирования Python для создания информативных логов, их маршрутизации и перехвата трассировок исключений. Также мы увидели, как централизовать и анализировать логи в JSON с помощью платформы управления логами.
How to write to a file, using the logging Python module?
How can I use the logging module in Python to write to a file? Every time I try to use it, it just prints out the message.
![]()
12 Answers 12
An example of using logging.basicConfig rather than logging.fileHandler()
In order, the five parts do the following:
- set the output file ( filename=logname )
- set it to append rather than overwrite ( filemode=’a’ )
- determine the format of the output message ( format=. )
- determine the format of the output time ( datefmt=’%H:%M:%S’ )
- and determine the minimum message level it will accept ( level=logging.DEBUG ).
And you’re good to go.
P.S. Make sure to read the logging HOWTO as well.
Here are two examples, one print the logs (stdout) the other write the logs to a file:
With this example, all logs will be printed and also be written to a file named logs.log
![]()
I prefer to use a configuration file. It allows me to switch logging levels, locations, etc without changing code when I go from development to release. I simply package a different config file with the same name, and with the same defined loggers.
Here is my code for the log config file
![]()
here’s a simpler way to go about it. this solution doesn’t use a config dictionary and uses a rotation file handler, like so:
the handlers variable needs to be an iterable. logpath+filename and debug_level are just variables holding the respective info. of course, the values for the function params are up to you.
the first time i was using the logging module i made the mistake of writing the following, which generates an OS file lock error (the above is the solution to that):
Logging HOWTO
Logging is a means of tracking events that happen when some software runs. The software’s developer adds logging calls to their code to indicate that certain events have occurred. An event is described by a descriptive message which can optionally contain variable data (i.e. data that is potentially different for each occurrence of the event). Events also have an importance which the developer ascribes to the event; the importance can also be called the level or severity.
When to use logging
Logging provides a set of convenience functions for simple logging usage. These are debug() , info() , warning() , error() and critical() . To determine when to use logging, see the table below, which states, for each of a set of common tasks, the best tool to use for it.
Task you want to perform
The best tool for the task
Display console output for ordinary usage of a command line script or program
Report events that occur during normal operation of a program (e.g. for status monitoring or fault investigation)
logging.info() (or logging.debug() for very detailed output for diagnostic purposes)
Issue a warning regarding a particular runtime event
warnings.warn() in library code if the issue is avoidable and the client application should be modified to eliminate the warning
logging.warning() if there is nothing the client application can do about the situation, but the event should still be noted
Report an error regarding a particular runtime event
Raise an exception
Report suppression of an error without raising an exception (e.g. error handler in a long-running server process)
logging.error() , logging.exception() or logging.critical() as appropriate for the specific error and application domain
The logging functions are named after the level or severity of the events they are used to track. The standard levels and their applicability are described below (in increasing order of severity):
Detailed information, typically of interest only when diagnosing problems.
Confirmation that things are working as expected.
An indication that something unexpected happened, or indicative of some problem in the near future (e.g. ‘disk space low’). The software is still working as expected.
Due to a more serious problem, the software has not been able to perform some function.
A serious error, indicating that the program itself may be unable to continue running.
The default level is WARNING , which means that only events of this level and above will be tracked, unless the logging package is configured to do otherwise.
Events that are tracked can be handled in different ways. The simplest way of handling tracked events is to print them to the console. Another common way is to write them to a disk file.
A simple example
A very simple example is:
If you type these lines into a script and run it, you’ll see:
printed out on the console. The INFO message doesn’t appear because the default level is WARNING . The printed message includes the indication of the level and the description of the event provided in the logging call, i.e. ‘Watch out!’. Don’t worry about the ‘root’ part for now: it will be explained later. The actual output can be formatted quite flexibly if you need that; formatting options will also be explained later.
Logging to a file
A very common situation is that of recording logging events in a file, so let’s look at that next. Be sure to try the following in a newly started Python interpreter, and don’t just continue from the session described above:
Changed in version 3.9: The encoding argument was added. In earlier Python versions, or if not specified, the encoding used is the default value used by open() . While not shown in the above example, an errors argument can also now be passed, which determines how encoding errors are handled. For available values and the default, see the documentation for open() .
And now if we open the file and look at what we have, we should find the log messages:
This example also shows how you can set the logging level which acts as the threshold for tracking. In this case, because we set the threshold to DEBUG , all of the messages were printed.
If you want to set the logging level from a command-line option such as:
and you have the value of the parameter passed for —log in some variable loglevel, you can use:
to get the value which you’ll pass to basicConfig() via the level argument. You may want to error check any user input value, perhaps as in the following example:
The call to basicConfig() should come before any calls to debug() , info() , etc. Otherwise, those functions will call basicConfig() for you with the default options. As it’s intended as a one-off simple configuration facility, only the first call will actually do anything: subsequent calls are effectively no-ops.
If you run the above script several times, the messages from successive runs are appended to the file example.log. If you want each run to start afresh, not remembering the messages from earlier runs, you can specify the filemode argument, by changing the call in the above example to:
The output will be the same as before, but the log file is no longer appended to, so the messages from earlier runs are lost.
Logging from multiple modules
If your program consists of multiple modules, here’s an example of how you could organize logging in it:
If you run myapp.py, you should see this in myapp.log:
which is hopefully what you were expecting to see. You can generalize this to multiple modules, using the pattern in mylib.py. Note that for this simple usage pattern, you won’t know, by looking in the log file, where in your application your messages came from, apart from looking at the event description. If you want to track the location of your messages, you’ll need to refer to the documentation beyond the tutorial level – see Advanced Logging Tutorial .
Logging variable data
To log variable data, use a format string for the event description message and append the variable data as arguments. For example:
As you can see, merging of variable data into the event description message uses the old, %-style of string formatting. This is for backwards compatibility: the logging package pre-dates newer formatting options such as str.format() and string.Template . These newer formatting options are supported, but exploring them is outside the scope of this tutorial: see Using particular formatting styles throughout your application for more information.
Changing the format of displayed messages
To change the format which is used to display messages, you need to specify the format you want to use:
which would print:
Notice that the ‘root’ which appeared in earlier examples has disappeared. For a full set of things that can appear in format strings, you can refer to the documentation for LogRecord attributes , but for simple usage, you just need the levelname (severity), message (event description, including variable data) and perhaps to display when the event occurred. This is described in the next section.
Displaying the date/time in messages
To display the date and time of an event, you would place ‘%(asctime)s’ in your format string:
which should print something like this:
The default format for date/time display (shown above) is like ISO8601 or RFC 3339. If you need more control over the formatting of the date/time, provide a datefmt argument to basicConfig , as in this example:
which would display something like this:
The format of the datefmt argument is the same as supported by time.strftime() .
Next Steps
That concludes the basic tutorial. It should be enough to get you up and running with logging. There’s a lot more that the logging package offers, but to get the best out of it, you’ll need to invest a little more of your time in reading the following sections. If you’re ready for that, grab some of your favourite beverage and carry on.
If your logging needs are simple, then use the above examples to incorporate logging into your own scripts, and if you run into problems or don’t understand something, please post a question on the comp.lang.python Usenet group (available at https://groups.google.com/g/comp.lang.python) and you should receive help before too long.
Still here? You can carry on reading the next few sections, which provide a slightly more advanced/in-depth tutorial than the basic one above. After that, you can take a look at the Logging Cookbook .
Advanced Logging Tutorial
The logging library takes a modular approach and offers several categories of components: loggers, handlers, filters, and formatters.
Loggers expose the interface that application code directly uses.
Handlers send the log records (created by loggers) to the appropriate destination.
Filters provide a finer grained facility for determining which log records to output.
Formatters specify the layout of log records in the final output.
Log event information is passed between loggers, handlers, filters and formatters in a LogRecord instance.
Logging is performed by calling methods on instances of the Logger class (hereafter called loggers). Each instance has a name, and they are conceptually arranged in a namespace hierarchy using dots (periods) as separators. For example, a logger named ‘scan’ is the parent of loggers ‘scan.text’, ‘scan.html’ and ‘scan.pdf’. Logger names can be anything you want, and indicate the area of an application in which a logged message originates.
A good convention to use when naming loggers is to use a module-level logger, in each module which uses logging, named as follows:
This means that logger names track the package/module hierarchy, and it’s intuitively obvious where events are logged just from the logger name.
The root of the hierarchy of loggers is called the root logger. That’s the logger used by the functions debug() , info() , warning() , error() and critical() , which just call the same-named method of the root logger. The functions and the methods have the same signatures. The root logger’s name is printed as ‘root’ in the logged output.
It is, of course, possible to log messages to different destinations. Support is included in the package for writing log messages to files, HTTP GET/POST locations, email via SMTP, generic sockets, queues, or OS-specific logging mechanisms such as syslog or the Windows NT event log. Destinations are served by handler classes. You can create your own log destination class if you have special requirements not met by any of the built-in handler classes.
By default, no destination is set for any logging messages. You can specify a destination (such as console or file) by using basicConfig() as in the tutorial examples. If you call the functions debug() , info() , warning() , error() and critical() , they will check to see if no destination is set; and if one is not set, they will set a destination of the console ( sys.stderr ) and a default format for the displayed message before delegating to the root logger to do the actual message output.
The default format set by basicConfig() for messages is:
You can change this by passing a format string to basicConfig() with the format keyword argument. For all options regarding how a format string is constructed, see Formatter Objects .
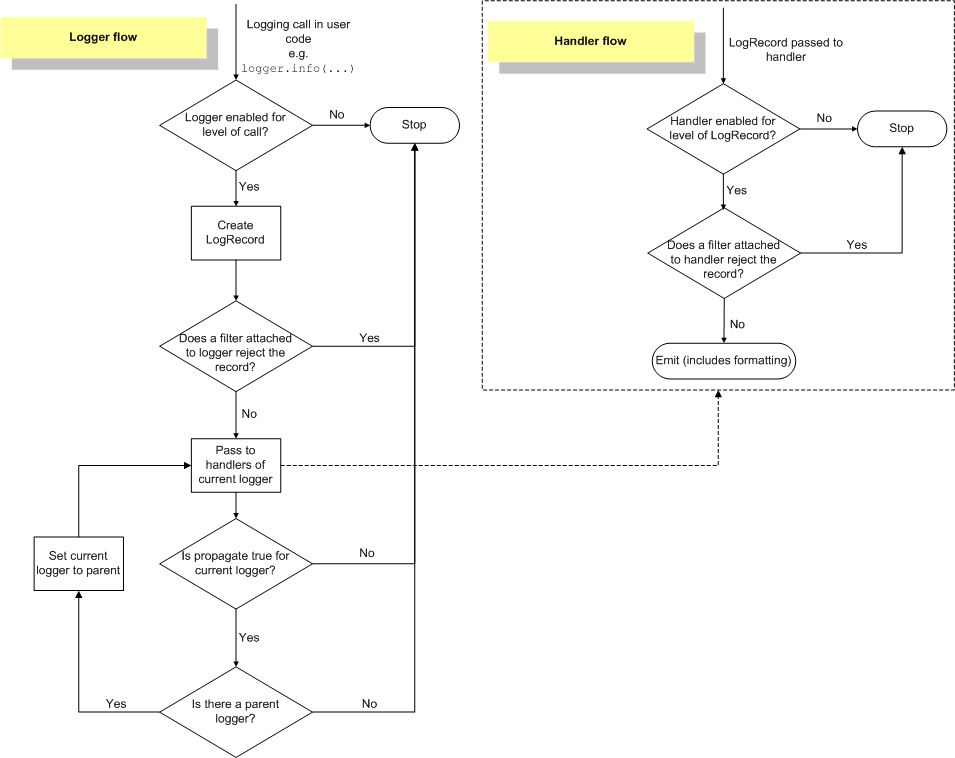
Logging Flow
The flow of log event information in loggers and handlers is illustrated in the following diagram.
Loggers
Logger objects have a threefold job. First, they expose several methods to application code so that applications can log messages at runtime. Second, logger objects determine which log messages to act upon based upon severity (the default filtering facility) or filter objects. Third, logger objects pass along relevant log messages to all interested log handlers.
The most widely used methods on logger objects fall into two categories: configuration and message sending.
These are the most common configuration methods:
Logger.setLevel() specifies the lowest-severity log message a logger will handle, where debug is the lowest built-in severity level and critical is the highest built-in severity. For example, if the severity level is INFO, the logger will handle only INFO, WARNING, ERROR, and CRITICAL messages and will ignore DEBUG messages.
Logger.addHandler() and Logger.removeHandler() add and remove handler objects from the logger object. Handlers are covered in more detail in Handlers .
Logger.addFilter() and Logger.removeFilter() add and remove filter objects from the logger object. Filters are covered in more detail in Filter Objects .
You don’t need to always call these methods on every logger you create. See the last two paragraphs in this section.
With the logger object configured, the following methods create log messages:
Logger.debug() , Logger.info() , Logger.warning() , Logger.error() , and Logger.critical() all create log records with a message and a level that corresponds to their respective method names. The message is actually a format string, which may contain the standard string substitution syntax of %s , %d , %f , and so on. The rest of their arguments is a list of objects that correspond with the substitution fields in the message. With regard to **kwargs , the logging methods care only about a keyword of exc_info and use it to determine whether to log exception information.
Logger.exception() creates a log message similar to Logger.error() . The difference is that Logger.exception() dumps a stack trace along with it. Call this method only from an exception handler.
Logger.log() takes a log level as an explicit argument. This is a little more verbose for logging messages than using the log level convenience methods listed above, but this is how to log at custom log levels.
getLogger() returns a reference to a logger instance with the specified name if it is provided, or root if not. The names are period-separated hierarchical structures. Multiple calls to getLogger() with the same name will return a reference to the same logger object. Loggers that are further down in the hierarchical list are children of loggers higher up in the list. For example, given a logger with a name of foo , loggers with names of foo.bar , foo.bar.baz , and foo.bam are all descendants of foo .
Loggers have a concept of effective level. If a level is not explicitly set on a logger, the level of its parent is used instead as its effective level. If the parent has no explicit level set, its parent is examined, and so on — all ancestors are searched until an explicitly set level is found. The root logger always has an explicit level set ( WARNING by default). When deciding whether to process an event, the effective level of the logger is used to determine whether the event is passed to the logger’s handlers.
Child loggers propagate messages up to the handlers associated with their ancestor loggers. Because of this, it is unnecessary to define and configure handlers for all the loggers an application uses. It is sufficient to configure handlers for a top-level logger and create child loggers as needed. (You can, however, turn off propagation by setting the propagate attribute of a logger to False .)
Handlers
Handler objects are responsible for dispatching the appropriate log messages (based on the log messages’ severity) to the handler’s specified destination. Logger objects can add zero or more handler objects to themselves with an addHandler() method. As an example scenario, an application may want to send all log messages to a log file, all log messages of error or higher to stdout, and all messages of critical to an email address. This scenario requires three individual handlers where each handler is responsible for sending messages of a specific severity to a specific location.
The standard library includes quite a few handler types (see Useful Handlers ); the tutorials use mainly StreamHandler and FileHandler in its examples.
There are very few methods in a handler for application developers to concern themselves with. The only handler methods that seem relevant for application developers who are using the built-in handler objects (that is, not creating custom handlers) are the following configuration methods:
The setLevel() method, just as in logger objects, specifies the lowest severity that will be dispatched to the appropriate destination. Why are there two setLevel() methods? The level set in the logger determines which severity of messages it will pass to its handlers. The level set in each handler determines which messages that handler will send on.
setFormatter() selects a Formatter object for this handler to use.
addFilter() and removeFilter() respectively configure and deconfigure filter objects on handlers.
Application code should not directly instantiate and use instances of Handler . Instead, the Handler class is a base class that defines the interface that all handlers should have and establishes some default behavior that child classes can use (or override).
Formatters
Formatter objects configure the final order, structure, and contents of the log message. Unlike the base logging.Handler class, application code may instantiate formatter classes, although you could likely subclass the formatter if your application needs special behavior. The constructor takes three optional arguments – a message format string, a date format string and a style indicator.
logging.Formatter. __init__ ( fmt = None , datefmt = None , style = ‘%’ ) 
If there is no message format string, the default is to use the raw message. If there is no date format string, the default date format is:
with the milliseconds tacked on at the end. The style is one of ‘%’ , ‘<' , or '$' . If one of these is not specified, then '%' will be used.
Changed in version 3.2: Added the style parameter.
The following message format string will log the time in a human-readable format, the severity of the message, and the contents of the message, in that order:
Formatters use a user-configurable function to convert the creation time of a record to a tuple. By default, time.localtime() is used; to change this for a particular formatter instance, set the converter attribute of the instance to a function with the same signature as time.localtime() or time.gmtime() . To change it for all formatters, for example if you want all logging times to be shown in GMT, set the converter attribute in the Formatter class (to time.gmtime for GMT display).
Configuring Logging
Programmers can configure logging in three ways:
Creating loggers, handlers, and formatters explicitly using Python code that calls the configuration methods listed above.
Creating a logging config file and reading it using the fileConfig() function.
Creating a dictionary of configuration information and passing it to the dictConfig() function.
For the reference documentation on the last two options, see Configuration functions . The following example configures a very simple logger, a console handler, and a simple formatter using Python code:
Running this module from the command line produces the following output:
The following Python module creates a logger, handler, and formatter nearly identical to those in the example listed above, with the only difference being the names of the objects:
Here is the logging.conf file:
The output is nearly identical to that of the non-config-file-based example:
You can see that the config file approach has a few advantages over the Python code approach, mainly separation of configuration and code and the ability of noncoders to easily modify the logging properties.
The fileConfig() function takes a default parameter, disable_existing_loggers , which defaults to True for reasons of backward compatibility. This may or may not be what you want, since it will cause any non-root loggers existing before the fileConfig() call to be disabled unless they (or an ancestor) are explicitly named in the configuration. Please refer to the reference documentation for more information, and specify False for this parameter if you wish.
The dictionary passed to dictConfig() can also specify a Boolean value with key disable_existing_loggers , which if not specified explicitly in the dictionary also defaults to being interpreted as True . This leads to the logger-disabling behaviour described above, which may not be what you want — in which case, provide the key explicitly with a value of False .
Note that the class names referenced in config files need to be either relative to the logging module, or absolute values which can be resolved using normal import mechanisms. Thus, you could use either WatchedFileHandler (relative to the logging module) or mypackage.mymodule.MyHandler (for a class defined in package mypackage and module mymodule , where mypackage is available on the Python import path).
In Python 3.2, a new means of configuring logging has been introduced, using dictionaries to hold configuration information. This provides a superset of the functionality of the config-file-based approach outlined above, and is the recommended configuration method for new applications and deployments. Because a Python dictionary is used to hold configuration information, and since you can populate that dictionary using different means, you have more options for configuration. For example, you can use a configuration file in JSON format, or, if you have access to YAML processing functionality, a file in YAML format, to populate the configuration dictionary. Or, of course, you can construct the dictionary in Python code, receive it in pickled form over a socket, or use whatever approach makes sense for your application.
Here’s an example of the same configuration as above, in YAML format for the new dictionary-based approach:
For more information about logging using a dictionary, see Configuration functions .
What happens if no configuration is provided
If no logging configuration is provided, it is possible to have a situation where a logging event needs to be output, but no handlers can be found to output the event. The behaviour of the logging package in these circumstances is dependent on the Python version.
For versions of Python prior to 3.2, the behaviour is as follows:
If logging.raiseExceptions is False (production mode), the event is silently dropped.
If logging.raiseExceptions is True (development mode), a message ‘No handlers could be found for logger X.Y.Z’ is printed once.
In Python 3.2 and later, the behaviour is as follows:
The event is output using a ‘handler of last resort’, stored in logging.lastResort . This internal handler is not associated with any logger, and acts like a StreamHandler which writes the event description message to the current value of sys.stderr (therefore respecting any redirections which may be in effect). No formatting is done on the message — just the bare event description message is printed. The handler’s level is set to WARNING , so all events at this and greater severities will be output.
To obtain the pre-3.2 behaviour, logging.lastResort can be set to None .
Configuring Logging for a Library
When developing a library which uses logging, you should take care to document how the library uses logging — for example, the names of loggers used. Some consideration also needs to be given to its logging configuration. If the using application does not use logging, and library code makes logging calls, then (as described in the previous section) events of severity WARNING and greater will be printed to sys.stderr . This is regarded as the best default behaviour.
If for some reason you don’t want these messages printed in the absence of any logging configuration, you can attach a do-nothing handler to the top-level logger for your library. This avoids the message being printed, since a handler will always be found for the library’s events: it just doesn’t produce any output. If the library user configures logging for application use, presumably that configuration will add some handlers, and if levels are suitably configured then logging calls made in library code will send output to those handlers, as normal.
A do-nothing handler is included in the logging package: NullHandler (since Python 3.1). An instance of this handler could be added to the top-level logger of the logging namespace used by the library (if you want to prevent your library’s logged events being output to sys.stderr in the absence of logging configuration). If all logging by a library foo is done using loggers with names matching ‘foo.x’, ‘foo.x.y’, etc. then the code:
should have the desired effect. If an organisation produces a number of libraries, then the logger name specified can be ‘orgname.foo’ rather than just ‘foo’.
It is strongly advised that you do not log to the root logger in your library. Instead, use a logger with a unique and easily identifiable name, such as the __name__ for your library’s top-level package or module. Logging to the root logger will make it difficult or impossible for the application developer to configure the logging verbosity or handlers of your library as they wish.
It is strongly advised that you do not add any handlers other than NullHandler to your library’s loggers. This is because the configuration of handlers is the prerogative of the application developer who uses your library. The application developer knows their target audience and what handlers are most appropriate for their application: if you add handlers ‘under the hood’, you might well interfere with their ability to carry out unit tests and deliver logs which suit their requirements.
Logging Levels
The numeric values of logging levels are given in the following table. These are primarily of interest if you want to define your own levels, and need them to have specific values relative to the predefined levels. If you define a level with the same numeric value, it overwrites the predefined value; the predefined name is lost.
Levels can also be associated with loggers, being set either by the developer or through loading a saved logging configuration. When a logging method is called on a logger, the logger compares its own level with the level associated with the method call. If the logger’s level is higher than the method call’s, no logging message is actually generated. This is the basic mechanism controlling the verbosity of logging output.
Logging messages are encoded as instances of the LogRecord class. When a logger decides to actually log an event, a LogRecord instance is created from the logging message.
Logging messages are subjected to a dispatch mechanism through the use of handlers, which are instances of subclasses of the Handler class. Handlers are responsible for ensuring that a logged message (in the form of a LogRecord ) ends up in a particular location (or set of locations) which is useful for the target audience for that message (such as end users, support desk staff, system administrators, developers). Handlers are passed LogRecord instances intended for particular destinations. Each logger can have zero, one or more handlers associated with it (via the addHandler() method of Logger ). In addition to any handlers directly associated with a logger, all handlers associated with all ancestors of the logger are called to dispatch the message (unless the propagate flag for a logger is set to a false value, at which point the passing to ancestor handlers stops).
Just as for loggers, handlers can have levels associated with them. A handler’s level acts as a filter in the same way as a logger’s level does. If a handler decides to actually dispatch an event, the emit() method is used to send the message to its destination. Most user-defined subclasses of Handler will need to override this emit() .
Custom Levels
Defining your own levels is possible, but should not be necessary, as the existing levels have been chosen on the basis of practical experience. However, if you are convinced that you need custom levels, great care should be exercised when doing this, and it is possibly a very bad idea to define custom levels if you are developing a library. That’s because if multiple library authors all define their own custom levels, there is a chance that the logging output from such multiple libraries used together will be difficult for the using developer to control and/or interpret, because a given numeric value might mean different things for different libraries.
Useful Handlers
In addition to the base Handler class, many useful subclasses are provided:
StreamHandler instances send messages to streams (file-like objects).
FileHandler instances send messages to disk files.
BaseRotatingHandler is the base class for handlers that rotate log files at a certain point. It is not meant to be instantiated directly. Instead, use RotatingFileHandler or TimedRotatingFileHandler .
RotatingFileHandler instances send messages to disk files, with support for maximum log file sizes and log file rotation.
TimedRotatingFileHandler instances send messages to disk files, rotating the log file at certain timed intervals.
SocketHandler instances send messages to TCP/IP sockets. Since 3.4, Unix domain sockets are also supported.
DatagramHandler instances send messages to UDP sockets. Since 3.4, Unix domain sockets are also supported.
SMTPHandler instances send messages to a designated email address.
SysLogHandler instances send messages to a Unix syslog daemon, possibly on a remote machine.
NTEventLogHandler instances send messages to a Windows NT/2000/XP event log.
MemoryHandler instances send messages to a buffer in memory, which is flushed whenever specific criteria are met.
HTTPHandler instances send messages to an HTTP server using either GET or POST semantics.
WatchedFileHandler instances watch the file they are logging to. If the file changes, it is closed and reopened using the file name. This handler is only useful on Unix-like systems; Windows does not support the underlying mechanism used.
QueueHandler instances send messages to a queue, such as those implemented in the queue or multiprocessing modules.
NullHandler instances do nothing with error messages. They are used by library developers who want to use logging, but want to avoid the ‘No handlers could be found for logger XXX’ message which can be displayed if the library user has not configured logging. See Configuring Logging for a Library for more information.
New in version 3.1: The NullHandler class.
New in version 3.2: The QueueHandler class.
The NullHandler , StreamHandler and FileHandler classes are defined in the core logging package. The other handlers are defined in a sub-module, logging.handlers . (There is also another sub-module, logging.config , for configuration functionality.)
Logged messages are formatted for presentation through instances of the Formatter class. They are initialized with a format string suitable for use with the % operator and a dictionary.
For formatting multiple messages in a batch, instances of BufferingFormatter can be used. In addition to the format string (which is applied to each message in the batch), there is provision for header and trailer format strings.
When filtering based on logger level and/or handler level is not enough, instances of Filter can be added to both Logger and Handler instances (through their addFilter() method). Before deciding to process a message further, both loggers and handlers consult all their filters for permission. If any filter returns a false value, the message is not processed further.
The basic Filter functionality allows filtering by specific logger name. If this feature is used, messages sent to the named logger and its children are allowed through the filter, and all others dropped.
Exceptions raised during logging
The logging package is designed to swallow exceptions which occur while logging in production. This is so that errors which occur while handling logging events — such as logging misconfiguration, network or other similar errors — do not cause the application using logging to terminate prematurely.
SystemExit and KeyboardInterrupt exceptions are never swallowed. Other exceptions which occur during the emit() method of a Handler subclass are passed to its handleError() method.
The default implementation of handleError() in Handler checks to see if a module-level variable, raiseExceptions , is set. If set, a traceback is printed to sys.stderr . If not set, the exception is swallowed.
The default value of raiseExceptions is True . This is because during development, you typically want to be notified of any exceptions that occur. It’s advised that you set raiseExceptions to False for production usage.
Using arbitrary objects as messages
In the preceding sections and examples, it has been assumed that the message passed when logging the event is a string. However, this is not the only possibility. You can pass an arbitrary object as a message, and its __str__() method will be called when the logging system needs to convert it to a string representation. In fact, if you want to, you can avoid computing a string representation altogether — for example, the SocketHandler emits an event by pickling it and sending it over the wire.
Optimization
Formatting of message arguments is deferred until it cannot be avoided. However, computing the arguments passed to the logging method can also be expensive, and you may want to avoid doing it if the logger will just throw away your event. To decide what to do, you can call the isEnabledFor() method which takes a level argument and returns true if the event would be created by the Logger for that level of call. You can write code like this:
so that if the logger’s threshold is set above DEBUG , the calls to expensive_func1() and expensive_func2() are never made.
In some cases, isEnabledFor() can itself be more expensive than you’d like (e.g. for deeply nested loggers where an explicit level is only set high up in the logger hierarchy). In such cases (or if you want to avoid calling a method in tight loops), you can cache the result of a call to isEnabledFor() in a local or instance variable, and use that instead of calling the method each time. Such a cached value would only need to be recomputed when the logging configuration changes dynamically while the application is running (which is not all that common).
There are other optimizations which can be made for specific applications which need more precise control over what logging information is collected. Here’s a list of things you can do to avoid processing during logging which you don’t need:
What you don’t want to collect
How to avoid collecting it
Information about where calls were made from.
Set logging._srcfile to None . This avoids calling sys._getframe() , which may help to speed up your code in environments like PyPy (which can’t speed up code that uses sys._getframe() ).
Set logging.logThreads to False .
Current process ID ( os.getpid() )
Set logging.logProcesses to False .
Current process name when using multiprocessing to manage multiple processes.