Debugging in Python
Debugging is really an art form. In this tutorial, we’ll cover some concepts and tools you can use for debugging, but the skills need time to develop.
The tutorial breaks debugging into three basic steps: testing code, finding bugs, and fixing them. Testing is a large topic on its own – there’s even a blog/podcast about it. We’ll only cover some basics and the unittest framework, so you may want to check out that blog to learn more.
The bulk of this tutorial is about finding bugs. The only tools required are Python ( pdb is included) and a text editor. However, I will give a demo using Spyder to show how an IDE can help. Many other IDEs have the same (or more) features, but Spyder was convenient for me and is FOSS (free as in beer and speech).
Fixing bugs is very code specific, thus not covered in detail.
Outline:
- What is debugging?
- Hunting for bugs (testing)
- interactive testing
- unit tests
- stack traces
- print statements everywhere!
- using pdb
- long-term debugging (user warnings)
- reporting (to OS projects)
What is debugging?
Quoting Wikipedia, “Debugging is the process of finding and resolving of defects that prevent correct operation of computer software or a system.” In reality, it is a very large topic with many different methodologies and steps. We’re going to focus on finding bugs, and talk a little about prevention.
There are two forms of finding bugs: discovering their existence (testing), and searching for the cause in the code (finding). The debugging cycle typically goes
Testing
There’s a whole range of things that fall under testing, from running the program and seeing if it gives you the output you want to a full suite of unit tests run every time you commit your changes. In Python, the most common form of testing is through interactive debugging using the REPL.
The REPL has been a major feature of interpreted languages like Python for good reason: quick and dirty testing.
- Don’t know how a library function behaves? Test it in the REPL.
- Unsure of your syntax? Check it in the REPL.
- Not sure how to tackle a problem? Try it step by step with some test data in the REPL.
Where this form of testing falls through is consistency and automation. Every time the developer makes a change, she has to remember what to test and type it into the command line. Even with tab completion, or copy and paste, this is repetitive and tests will be missed.
That’s where unit tests come in. Unit tests are the smallest testable parts of a program. That smallness of them makes them easier to automate, and also (as we’ll see) easier to debug. Python includes a module unittest that can handle this work flow.
As an example, let’s make a function that will split a list in the middle. It will take a list of arbitrary length, and return a tuple containing (first half, middle element, last half). We’ll follow a Test Driven Design (TDD) style, and create the tests first. This clearly defines the behaviour.
A good testing suite should include a few examples of normal/expected input as well as any edge cases you can think of. Let’s fill in more tests now.
Now, run the suite (which will get us into debugging/finding mode)
(The unittest module has test discovery that will search for tests in the current directory using some rules.)
First, we’ll suppress the errors by actually defining the function. Next, we’ll come up with a solution (and hopefully make a few mistakes along the way.
Finding bugs
After discovering that a bug exists, the next challenge is finding where the bug is in code. We’ve already seen how unit testing can help narrow it down to a function, but what if that function is more complicated, or we get an error, or the bug came up in use and not in testing?
There are a few tools for this.
Fist, stack traces. These are the messages the Python interpreter gives when there’s an uncaught exception. At first, they may seem cryptic, but it’s pretty straight-forward. From bottom to top, the trace prints:
- the error type and message (e.g. SyntaxError, IndexError, …)
- [the line in which the error happened]
- the function in which the error happened, along with the filename and line number
- The filename, line number, and function that called the function with the error (and all the way up the stack)
We’ll see an example of this with a partially working splitter function.
Print debugging
Sometimes the stack trace isn’t enough, like when a function returns the wrong value, or you’re not sure if a loop is behaving properly. The quick fall-back for this is to insert print statements wherever you’re unsure of the value.
Let’s do a little debugging of a broken average-taking function.
Using pdb
This is the more sophisticated way. You may have noticed that one annoyance with print is that you need to quit and restart python whenever the function definition is changed. Using pdb , the execution is interrupted, and we can check the values of variables whenever we like.
To use pdb , you first need to import it, and add the line pdb.set_trace() where you’d like to start doing introspection. e.g.
Next, when the execution is interrupted, use the commands
- p <variable> for printing the value of a variable
- n to execute the next line
- s to step into a function call
- c to continue execution
- !<code> to run any line of python (including changing values)
Lets repeat the demo for average() using the debugger in Spyder (which just runs pdb for us).
Note: sometimes print debugging is still useful, like in a loop if you don’t want to stop every iteration, but want to see the values as they come up.
Helping the user
There are a couple other problems with using print() for debugging:
- you may forget to remove a print statement
- it messes up unit tests
- it corrupts the useful output to the user with debugging output
For these reasons, it’s better to use the logging module.
Using logging.debug() instead of print() lets you output the debugging statements to a file, instead of stdout . An example from the python docs,
Creating logs this way will also automatically format the messages (which you can customize). This is a good way to provide debugging data to your users, like warnings that their data is in the wrong format or that another function is better.
A brief mention of reporting bugs
It should also be mentioned that users can report bugs to developers. Each project likely has its own bug tracking system, but GitHub and other hosts provide issue trackers. It’s a good idea to let users report bugs, and to report bugs in other projects that you use.
With more practice in fixing bugs, you’ll also have a better idea of what should be included in a bug report.
pdb — The Python Debugger
The module pdb defines an interactive source code debugger for Python programs. It supports setting (conditional) breakpoints and single stepping at the source line level, inspection of stack frames, source code listing, and evaluation of arbitrary Python code in the context of any stack frame. It also supports post-mortem debugging and can be called under program control.
The debugger is extensible – it is actually defined as the class Pdb . This is currently undocumented but easily understood by reading the source. The extension interface uses the modules bdb and cmd .
Used to dump Python tracebacks explicitly, on a fault, after a timeout, or on a user signal.
Standard interface to extract, format and print stack traces of Python programs.
The typical usage to break into the debugger is to insert:
at the location you want to break into the debugger, and then run the program. You can then step through the code following this statement, and continue running without the debugger using the continue command.
New in version 3.7: The built-in breakpoint() , when called with defaults, can be used instead of import pdb; pdb.set_trace() .
The debugger’s prompt is (Pdb) , which is the indicator that you are in debug mode:
Changed in version 3.3: Tab-completion via the readline module is available for commands and command arguments, e.g. the current global and local names are offered as arguments of the p command.
You can also invoke pdb from the command line to debug other scripts. For example:
When invoked as a module, pdb will automatically enter post-mortem debugging if the program being debugged exits abnormally. After post-mortem debugging (or after normal exit of the program), pdb will restart the program. Automatic restarting preserves pdb’s state (such as breakpoints) and in most cases is more useful than quitting the debugger upon program’s exit.
New in version 3.2: -c option is introduced to execute commands as if given in a .pdbrc file, see Debugger Commands .
New in version 3.7: -m option is introduced to execute modules similar to the way python -m does. As with a script, the debugger will pause execution just before the first line of the module.
Typical usage to execute a statement under control of the debugger is:
The typical usage to inspect a crashed program is:
The module defines the following functions; each enters the debugger in a slightly different way:
pdb. run ( statement , globals = None , locals = None ) 
Execute the statement (given as a string or a code object) under debugger control. The debugger prompt appears before any code is executed; you can set breakpoints and type continue , or you can step through the statement using step or next (all these commands are explained below). The optional globals and locals arguments specify the environment in which the code is executed; by default the dictionary of the module __main__ is used. (See the explanation of the built-in exec() or eval() functions.)
pdb. runeval ( expression , globals = None , locals = None ) 
Evaluate the expression (given as a string or a code object) under debugger control. When runeval() returns, it returns the value of the expression. Otherwise this function is similar to run() .
pdb. runcall ( function , * args , ** kwds ) 
Call the function (a function or method object, not a string) with the given arguments. When runcall() returns, it returns whatever the function call returned. The debugger prompt appears as soon as the function is entered.
pdb. set_trace ( * , header = None ) 
Enter the debugger at the calling stack frame. This is useful to hard-code a breakpoint at a given point in a program, even if the code is not otherwise being debugged (e.g. when an assertion fails). If given, header is printed to the console just before debugging begins.
Changed in version 3.7: The keyword-only argument header.
Enter post-mortem debugging of the given traceback object. If no traceback is given, it uses the one of the exception that is currently being handled (an exception must be being handled if the default is to be used).
Enter post-mortem debugging of the traceback found in sys.last_traceback .
The run* functions and set_trace() are aliases for instantiating the Pdb class and calling the method of the same name. If you want to access further features, you have to do this yourself:
class pdb. Pdb ( completekey = ‘tab’ , stdin = None , stdout = None , skip = None , nosigint = False , readrc = True ) 
Pdb is the debugger class.
The completekey, stdin and stdout arguments are passed to the underlying cmd.Cmd class; see the description there.
The skip argument, if given, must be an iterable of glob-style module name patterns. The debugger will not step into frames that originate in a module that matches one of these patterns. 1
By default, Pdb sets a handler for the SIGINT signal (which is sent when the user presses Ctrl — C on the console) when you give a continue command. This allows you to break into the debugger again by pressing Ctrl — C . If you want Pdb not to touch the SIGINT handler, set nosigint to true.
The readrc argument defaults to true and controls whether Pdb will load .pdbrc files from the filesystem.
Example call to enable tracing with skip:
Raises an auditing event pdb.Pdb with no arguments.
New in version 3.1: The skip argument.
New in version 3.2: The nosigint argument. Previously, a SIGINT handler was never set by Pdb.
Changed in version 3.6: The readrc argument.
See the documentation for the functions explained above.
Debugger Commands
The commands recognized by the debugger are listed below. Most commands can be abbreviated to one or two letters as indicated; e.g. h(elp) means that either h or help can be used to enter the help command (but not he or hel , nor H or Help or HELP ). Arguments to commands must be separated by whitespace (spaces or tabs). Optional arguments are enclosed in square brackets ( [] ) in the command syntax; the square brackets must not be typed. Alternatives in the command syntax are separated by a vertical bar ( | ).
Entering a blank line repeats the last command entered. Exception: if the last command was a list command, the next 11 lines are listed.
Commands that the debugger doesn’t recognize are assumed to be Python statements and are executed in the context of the program being debugged. Python statements can also be prefixed with an exclamation point ( ! ). This is a powerful way to inspect the program being debugged; it is even possible to change a variable or call a function. When an exception occurs in such a statement, the exception name is printed but the debugger’s state is not changed.
The debugger supports aliases . Aliases can have parameters which allows one a certain level of adaptability to the context under examination.
Multiple commands may be entered on a single line, separated by ;; . (A single ; is not used as it is the separator for multiple commands in a line that is passed to the Python parser.) No intelligence is applied to separating the commands; the input is split at the first ;; pair, even if it is in the middle of a quoted string. A workaround for strings with double semicolons is to use implicit string concatenation ‘;»;’ or ";"";" .
If a file .pdbrc exists in the user’s home directory or in the current directory, it is read with ‘utf-8’ encoding and executed as if it had been typed at the debugger prompt. This is particularly useful for aliases. If both files exist, the one in the home directory is read first and aliases defined there can be overridden by the local file.
Changed in version 3.11: .pdbrc is now read with ‘utf-8’ encoding. Previously, it was read with the system locale encoding.
Changed in version 3.2: .pdbrc can now contain commands that continue debugging, such as continue or next . Previously, these commands had no effect.
Without argument, print the list of available commands. With a command as argument, print help about that command. help pdb displays the full documentation (the docstring of the pdb module). Since the command argument must be an identifier, help exec must be entered to get help on the ! command.
Print a stack trace, with the most recent frame at the bottom. An arrow ( > ) indicates the current frame, which determines the context of most commands.
Move the current frame count (default one) levels down in the stack trace (to a newer frame).
Move the current frame count (default one) levels up in the stack trace (to an older frame).
b(reak) [([filename:]lineno | function) [, condition]] 
With a lineno argument, set a break there in the current file. With a function argument, set a break at the first executable statement within that function. The line number may be prefixed with a filename and a colon, to specify a breakpoint in another file (probably one that hasn’t been loaded yet). The file is searched on sys.path . Note that each breakpoint is assigned a number to which all the other breakpoint commands refer.
If a second argument is present, it is an expression which must evaluate to true before the breakpoint is honored.
Without argument, list all breaks, including for each breakpoint, the number of times that breakpoint has been hit, the current ignore count, and the associated condition if any.
tbreak [([filename:]lineno | function) [, condition]] 
Temporary breakpoint, which is removed automatically when it is first hit. The arguments are the same as for break .
cl(ear) [filename:lineno | bpnumber . ] 
With a filename:lineno argument, clear all the breakpoints at this line. With a space separated list of breakpoint numbers, clear those breakpoints. Without argument, clear all breaks (but first ask confirmation).
Disable the breakpoints given as a space separated list of breakpoint numbers. Disabling a breakpoint means it cannot cause the program to stop execution, but unlike clearing a breakpoint, it remains in the list of breakpoints and can be (re-)enabled.
Enable the breakpoints specified.
ignore bpnumber [count] 
Set the ignore count for the given breakpoint number. If count is omitted, the ignore count is set to 0. A breakpoint becomes active when the ignore count is zero. When non-zero, the count is decremented each time the breakpoint is reached and the breakpoint is not disabled and any associated condition evaluates to true.
condition bpnumber [condition] 
Set a new condition for the breakpoint, an expression which must evaluate to true before the breakpoint is honored. If condition is absent, any existing condition is removed; i.e., the breakpoint is made unconditional.
Specify a list of commands for breakpoint number bpnumber. The commands themselves appear on the following lines. Type a line containing just end to terminate the commands. An example:
To remove all commands from a breakpoint, type commands and follow it immediately with end ; that is, give no commands.
With no bpnumber argument, commands refers to the last breakpoint set.
You can use breakpoint commands to start your program up again. Simply use the continue command, or step , or any other command that resumes execution.
Specifying any command resuming execution (currently continue , step , next , return , jump , quit and their abbreviations) terminates the command list (as if that command was immediately followed by end). This is because any time you resume execution (even with a simple next or step), you may encounter another breakpoint—which could have its own command list, leading to ambiguities about which list to execute.
If you use the silent command in the command list, the usual message about stopping at a breakpoint is not printed. This may be desirable for breakpoints that are to print a specific message and then continue. If none of the other commands print anything, you see no sign that the breakpoint was reached.
Execute the current line, stop at the first possible occasion (either in a function that is called or on the next line in the current function).
Continue execution until the next line in the current function is reached or it returns. (The difference between next and step is that step stops inside a called function, while next executes called functions at (nearly) full speed, only stopping at the next line in the current function.)
Without argument, continue execution until the line with a number greater than the current one is reached.
With lineno, continue execution until a line with a number greater or equal to lineno is reached. In both cases, also stop when the current frame returns.
Changed in version 3.2: Allow giving an explicit line number.
Continue execution until the current function returns.
Continue execution, only stop when a breakpoint is encountered.
Set the next line that will be executed. Only available in the bottom-most frame. This lets you jump back and execute code again, or jump forward to skip code that you don’t want to run.
It should be noted that not all jumps are allowed – for instance it is not possible to jump into the middle of a for loop or out of a finally clause.
l(ist) [first[, last]] 
List source code for the current file. Without arguments, list 11 lines around the current line or continue the previous listing. With . as argument, list 11 lines around the current line. With one argument, list 11 lines around at that line. With two arguments, list the given range; if the second argument is less than the first, it is interpreted as a count.
The current line in the current frame is indicated by -> . If an exception is being debugged, the line where the exception was originally raised or propagated is indicated by >> , if it differs from the current line.
New in version 3.2: The >> marker.
List all source code for the current function or frame. Interesting lines are marked as for list .
New in version 3.2.
Print the arguments of the current function and their current values.
Evaluate expression in the current context and print its value.
print() can also be used, but is not a debugger command — this executes the Python print() function.
Like the p command, except the value of expression is pretty-printed using the pprint module.
Print the type of expression.
Try to get source code of expression and display it.
New in version 3.2.
Display the value of expression if it changed, each time execution stops in the current frame.
Without expression, list all display expressions for the current frame.
Display evaluates expression and compares to the result of the previous evaluation of expression, so when the result is mutable, display may not be able to pick up the changes.
Display won’t realize lst has been changed because the result of evaluation is modified in place by lst.append(1) before being compared:
You can do some tricks with copy mechanism to make it work:
New in version 3.2.
Do not display expression anymore in the current frame. Without expression, clear all display expressions for the current frame.
New in version 3.2.
Start an interactive interpreter (using the code module) whose global namespace contains all the (global and local) names found in the current scope.
New in version 3.2.
Create an alias called name that executes command. The command must not be enclosed in quotes. Replaceable parameters can be indicated by %1 , %2 , and so on, while %* is replaced by all the parameters. If command is omitted, the current alias for name is shown. If no arguments are given, all aliases are listed.
Aliases may be nested and can contain anything that can be legally typed at the pdb prompt. Note that internal pdb commands can be overridden by aliases. Such a command is then hidden until the alias is removed. Aliasing is recursively applied to the first word of the command line; all other words in the line are left alone.
As an example, here are two useful aliases (especially when placed in the .pdbrc file):
Delete the specified alias name.
Execute the (one-line) statement in the context of the current stack frame. The exclamation point can be omitted unless the first word of the statement resembles a debugger command. To set a global variable, you can prefix the assignment command with a global statement on the same line, e.g.:
Restart the debugged Python program. If args is supplied, it is split with shlex and the result is used as the new sys.argv . History, breakpoints, actions and debugger options are preserved. restart is an alias for run .
Quit from the debugger. The program being executed is aborted.
Enter a recursive debugger that steps through code (which is an arbitrary expression or statement to be executed in the current environment).
Print the return value for the last return of the current function.
Whether a frame is considered to originate in a certain module is determined by the __name__ in the frame globals.
Introduction

In software development, debugging is the process of looking for and then resolving issues that prevent the software from running correctly.
The Python debugger provides a debugging environment for Python programs. It supports setting conditional breakpoints, stepping through the source code one line at a time, stack inspection, and more.
Working Interactively with the Python Debugger
The Python debugger comes as part of the standard Python distribution as a module called pdb . The debugger is also extensible, and is defined as the class Pdb . You can read the official documentation of pdb to learn more.
We’ll begin by working with a short program that has two global variables, a function that creates a nested loop, and the if __name__ == '__main__': construction that will call the nested_loop() function.
We can now run this program through the Python debugger by using the following command:
- python -m pdb looping.py
The -m command-line flag will import any Python module for you and run it as a script. In this case we are importing and running the pdb module, which we pass into the command as shown above.
Upon running this command, you’ll receive the following output:
In the output, the first line contains the current module name (as indicated with <module> ) with a directory path, and the printed line number that follows (in this case it’s 1 , but if there is a comment or other non-executable line it could be a higher number). The second line shows the current line of source code that is executed here, as pdb provides an interactive console for debugging. You can use the command help to learn its commands, and help command to learn more about a specific command. Note that the pdb console is different than the Python interactive shell.
The Python debugger will automatically start over when it reaches the end of your program. Whenever you want to leave the pdb console, type the command quit or exit . If you would like to explicitly restart a program at any place within the program, you can do so with the command run .
Using the Debugger to Move through a Program
When working with programs in the Python debugger, you’re likely to use the list , step , and next commands to move through your code. We’ll go over these commands in this section.
Within the shell, we can type the command list in order to get context around the current line. From the first line of the program looping.py that we displayed above — num_list = [500, 600, 700] — that will look like this:
The current line is indicated with the characters -> , which in our case is the first line of the program file.
Since this is a relatively short program, we receive nearly all of the program back with the list command. Without providing arguments, the list command provides 11 lines around the current line, but you can also specify which lines to include, like so:
Here, we requested that the lines 3–7 be displayed by using the command list 3, 7 .
To move through the program line by line, we can use step or next :
The difference between step and next is that step will stop within a called function, while next executes called functions to only stop at the next line of the current function. We can see this difference when we work with the function.
The step command will iterate through the loops once it gets to the running of the function, showing exactly what the loop is doing, as it will first print a number with print(number) then go through to print the letters with print(letter) , return to the number, etc:
The next command, instead, will execute the entire function without showing the step-by-step process. Let’s quit the current session with the exit command and then begin the debugger again:
- python -m pdb looping.py
Now we can work with the next command:
While going through your code, you may want to examine the value passed to a variable, which you can do with the pp command, which will pretty-print the value of the expression using the pprint module:
Most commands in pdb have shorter aliases. For step that short form is s , and for next it is n . The help command will list available aliases. You can also call the last command you called by pressing the ENTER key at the prompt.
Breakpoints
You typically will be working with larger programs than the example above, so you’ll likely be wanting to look at particular functions or lines rather than going through an entire program. By using the break command to set breakpoints, you’ll run the program up until the specified breakpoint.
When you insert a breakpoint, the debugger assigns a number to it. The numbers assigned to breakpoints are successive integers that begin with the number 1, which you can refer to when working with breakpoints.
Breakpoints can be placed at certain line numbers by following the syntax of <program_file>:<line_number> as shown below:
Type clear and then y to remove all current breakpoints. You can then place a breakpoint where a function is defined:
To remove current breakpoints, type clear and then y . You can also set up a condition:
Now, if we issue the continue command, the program will break when the number x is evaluated to being greater than 500 (that is, when it is set equal to 600 in the second iteration of the outer loop):
To see a list of breakpoints that are currently set to run, use the command break without any arguments. You’ll receive information about the particularities of the breakpoint(s) you’ve set:
We can also disable a breakpoint with the command disable and the number of the breakpoint. In this session, we add another breakpoint and then disable the first one:
To enable a breakpoint, use the enable command, and to remove a breakpoint entirely, use the clear command:
Breakpoints in pdb provide you with a lot of control. Some additional functionalities include ignoring breakpoints during the current iteration of the program with the ignore command (as in ignore 1 ), triggering actions to occur at a breakpoint with the commands command (as in command 1 ), and creating temporary breakpoints that are automatically cleared the first time program execution hits the point with the command tbreak (for a temporary break at line 3, for example, you could type tbreak 3 ).
Integrating pdb into Programs
You can trigger a debugging session by importing the pdb module and adding the pdb function pdb.set_trace() above the line where you would like the session to begin.
In our sample program above, we’ll add the import statement and the function where we would like to enter into the debugger. For our example, let’s add it before the nested loop.
By adding the debugger into your code you do not need to launch your program in a special way or remember to set breakpoints.
Importing the pdb module and running the pdb.set_trace() function lets you begin your program as usual and run the debugger through its execution.
Modifying Program Execution Flow
The Python debugger lets you change the flow of your program at runtime with the jump command. This lets you skip forward to prevent some code from running, or can let you go backwards to run the code again.
We’ll be working with a small program that creates a list of the letters contained in the string sammy = "sammy" :
If we run the program as usual with the python letter_list.py command, we’ll receive the following output:
With the Python debugger, let’s show how we can change the execution by first jumping ahead after the first cycle. When we do this, we’ll notice that there is a disruption of the for loop:
- python -m pdb letter_list.py
The above debugging session puts a break at line 5 to prevent code from continuing, then continues through code (along with pretty-printing some values of letter to show what is happening). Next, we use the jump command to skip to line 6. At this point, the variable letter is set equal to the string 'a' , but we jump the code that adds that to the list sammy_list . We then disable the breakpoint to proceed with the execution as usual with the continue command, so 'a' is never appended to sammy_list .
Next, we can quit this first session and restart the debugger to jump back within the program to re-run a statement that has already been executed. This time, we’ll run the first iteration of the for loop again in the debugger:
In the debugging session above, we added a break at line 6, and then jumped back to line 5 after continuing. We pretty-printed along the way to show that the string 's' was being appended to the list sammy_list twice. We then disabled the break at line 6 and continued running the program. The output shows two values of 's' appended to sammy_list .
Some jumps are prevented by the debugger, especially when jumping in and out of certain flow control statements that are undefined. For example, you cannot jump into functions before arguments are defined, and you cannot jump into the middle of a try:except statement. You also cannot jump out of a finally block.
The jump statement with the Python debugger allows you to change the execution flow while debugging a program to see whether flow control can be modified to different purposes or to better understand what issues are arising in your code.
Table of Common pdb Commands
Here is a table of useful pdb commands along with their short forms to keep in mind while working with the Python debugger.
CommandShort formWhat it does argsa Print the argument list of the current function breakb Creates a breakpoint (requires parameters) in the program execution continuec or cont Continues program execution helph Provides list of commands or help for a specified command jumpj Set the next line to be executed listl Print the source code around the current line nextn Continue execution until the next line in the current function is reached or returns steps Execute the current line, stopping at first possible occasion pppp Pretty-prints the value of the expression quit or exitq Aborts the program returnr Continue execution until the current function returns
You can read more about the commands and working with the debugger from the Python debugger documentation.
Conclusion
Debugging is an important step of any software development project. The Python debugger pdb implements an interactive debugging environment that you can use with any of your programs written in Python.
With features that let you pause your program, look at what values your variables are set to, and go through program execution in a discrete step-by-step manner, you can more fully understand what your program is doing and find bugs that exist in the logic or troubleshoot known issues.
Профилирование и отладка Python, отладка
В предыдущей статье мы закончили разговор о профилировании обзором событийных профайлеров.
Сегодня я предлагаю рассмотреть методы отладки программ.
-
— зачем вообще нужно профилирование, различные подходы, инструменты и отличия между ними — переходим к практике — инструменты и их применение
- Отладка — что делать, когда ничего не работает
Прежде, чем начинать разговор об отладке, нам нужно определиться, что же это такое. По традиции, обратимся к Википедии: «Отладка — обнаружение, локализация и устранение ошибок». Вообще, для успешной отладки программы, нам необходимо (но не всегда достаточно) две вещи: значение переменных в том месте программы, в котором произошла ошибка, а так же стектрейс: порядок вызова функций, вплоть до ошибочной. Полезно так же знать об окружении, в котором выполняется программа: наличие (или отсутствие) свободной памяти, системные ограничения (например, на количество файловых дескрипторов) и так далее, но это слегка выходит за пределы нашей статьи.
Классика жанра
Что делает начинающий программист, когда хочет «проникнуть» внутрь программы и изучить содержимое переменных (в нужных местах) и логику работы программы (вызовы функций, выполнение условий)? Он прибегает к самому распространённому, самому простому и самому «действенному» способу отладки: расставляет по всему коду «принты» (оператор print в Python 2.x и функция print() в Python 3.x). Но не только начинающие грешат этим: продвинутые разработчики частенько ленятся использовать специальные инструменты для отладки, надеясь быстренько, за пару минут, найти причину ошибки и всё исправить, и не замечая, что поиски ошибок растягиваются на часы и даже дни. Кстати, такой подход называют «журналированием».
Сюда же относится запись всей нужной для отладки программы информации в лог-файл. Иногда других вариантов нет, например, когда скрипт работает в продакшене и ошибки возникают эпизодически, или когда ошибка проявляется только после долгой работы программы (скажем, через две-три недели после запуска).
Но мы же пишем на Python, так почему бы не воспользоваться встроенными средствами отладки или инструментами, предлагаемыми сообществом? Например, вместо обычного логгирования в файл имеет смысл использовать Sentry, чтобы кроме сообщения об ошибке можно было отправить дополнительную информацию: стектрейс со всеми локальными переменными, любые другие переменные и вообще всё, что посчитаете нужным.
The Python Debugger
Python имеет встроенный отладчик: модуль pdb. В принципе, на этом можно было бы закончить статью, т.к. pdb — чрезвычайно мощный отладчик и всё остальное, по сути, всего лишь «украшательства» к нему. Но мы продолжим =)
Как можно заметить из названия, pdb многое взял от gdb (GNU Project debugger) — отладчика Си (и не только) программ. К слову, программы на Python можно отлаживать и с помощью gdb, просто это немножко сложнее и дольше, хотя тем, кто хочет углубиться в устройство языка, а так же тем, кто пишет сишные модули для питона без gdb никак не обойтись. Кроме того, gdb позволяет подключиться к уже работающей программе (через её pid) и заниматься её отладкой «прямо на месте».
Я сейчас не буду подробно описывать pdb, вот замечательная статья Дага Хеллманна (Doug Hellmann): pdb – Interactive Debugger на очень полезном ресурсе Python Module of the Week, а вот её хороший перевод на хабре: pdb – Интерактивный отладчик, выполненный пользователем xa4a.
IPython pdb
Предлагаю сразу поставить IPython и модуль ipdb для него:
IPython (и ipdb, как его часть) предлагает «более лучшую» консоль и, как следствие, более удобную отладку программ: подсветка кода, автодополнение, историю команд, динамическую интроспекцию любых объектов, магические функции, алиасы и многое другое. Полный список улучшений можно посмотреть в документации или прямо из консоли IPython, введя "?" в качестве команды. Всё это помогает при отладке и делает её простой и увлекательной.
Запустить отладку скрипта в ipdb можно несколькими способами:
Эти команды откроют программу в отладчике, дальше можно делать всё, что угодно: ставить брейкпоинты, изучать её работу по шагам или просто запустить программу — отладчик автоматически остановится при возникновении неотловленного исключения.
Но обычно такой вариант чересчур изнурителен: пока доберёшься до нужного места всеми этими «next», «step», да и ставить точку останова («break») руками каждый раз утомительно. Гораздо удобнее в нужном месте программы вставить следующую строку:
И тогда при исполнении этой строки выполнение программы приостановится и будет запущен отладчик, — дальше можно начинать углубляться в изучение программы. По сути, функция «set_trace» — это установка точки останова (breakpoint).
Python Debugger имеет ещё один режим работы, который в некоторых случаях оказывается удобнее фукнции set_trace. Он называется «post mortem»: запуск отладчика с заданным трейсбеком:
В случае возникновения любых неотлавливаемых исключений в функции «some_code» будет вызван отладчик в том месте программы, где произошло исключение.
debug
Интересной заменой функции «set_trace» является модуль debug, который просто импортирует библиотеки ipdb и see (удобная альтернатива функции dir) и запускает отладку. Единственным плюсом модуля является удобство использования, достаточно в любом месте программы вставить строку:
И при выполнении этой строки будет вызван отладчик «ipdb» и импортирован модуль «see».
ipdbplugin
Ещё одна интересная и, на этот раз, полезная библиотека: nose-ipdb. С её помощью можно автоматически запускать отладчик при ошибках (исключениях) или же просто при неверно отработанных тестах (я надеюсь, вы используете nose? =). Для запуска отладчика ipdb при ошибках, достаточно при запуске тестов добавить ключ "—ipdb":
А для запуска отладчика при некорректно завершившихся тестов нужно добавить ключ "—ipdb-failures":
Конечно, можно ловить всё и сразу:
Я каждый день использую этот модуль и просто не представляю себе жизни без него.
werkzeug
Потрясающий проект Армина Ронахера (Armin Ronacher), автора фреймворка Flask и вообще одного из крутейших программистов Python называется werkzeug и представляет собой сборник различных утилит для WSGI приложений. Одна из них — клёвый отладчик, который позволяет выводить удобный трейсбек ошибки, а так же запускать консоль Python в соответствующем месте трейсбека прямо на странице браузера: 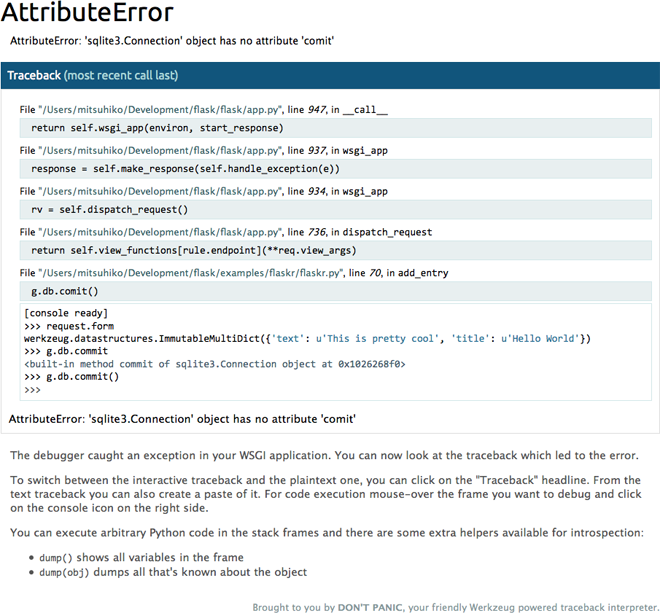
Использовать его очень просто, достаточно обернуть приложение с помощью соответствующего middleware:
Говорят, что werkzeug умеет отлаживать даже Ajax-запросы, но, к сожалению, я сам лично никогда этого не делал. Буду рад любым комментариям на эту тему.
django-pdb
Ещё один хороший модуль, на этот раз для Django: django-pdb. Он позволяет запускать отладчик при наличии соответствующего GET-параметра в запросе (например: http://127.0.0.1:8000/app/view?ipdb) либо для всех запросов:
Либо вызывать отладчик при возникновении исключений (режим «post-mortem»):
django-extensions
Но гораздо лучше в Django использовать модуль django-extensions, который добавляет очень полезную команду runserver_plus. С помощью этой батарейки можно подружить Django и Werkzeug (см. выше) и начать получать удовольствие от страниц с пятисотой ошибкой =)
Для использования всего этого чуда достаточно запустить девелоперский сервер с помощью команды runserver_plus:
sentry
Отладка программы в девелоперском окружении это, конечно, удобно и хорошо, но самое сложное — локализовать проблему по багрепорту от живого пользователя. Иногда это бывает сложно. Несмотря на все преимущества Python, модуля «телепатии» не существует, и разработчик остаётся один на один со словами пользователя «ничего не работает. 11».
Проект Sentry позволяет сохранять каждую ошибку пользователя с текстом исключения, полным стектрейсом исключения и значениями всех локальных переменных в каждой из функций стектрейса, а так же много другой информации: окружение пользователя (браузер, ОС), все заголовки запроса и вообще всё, что пожелает разработчик. 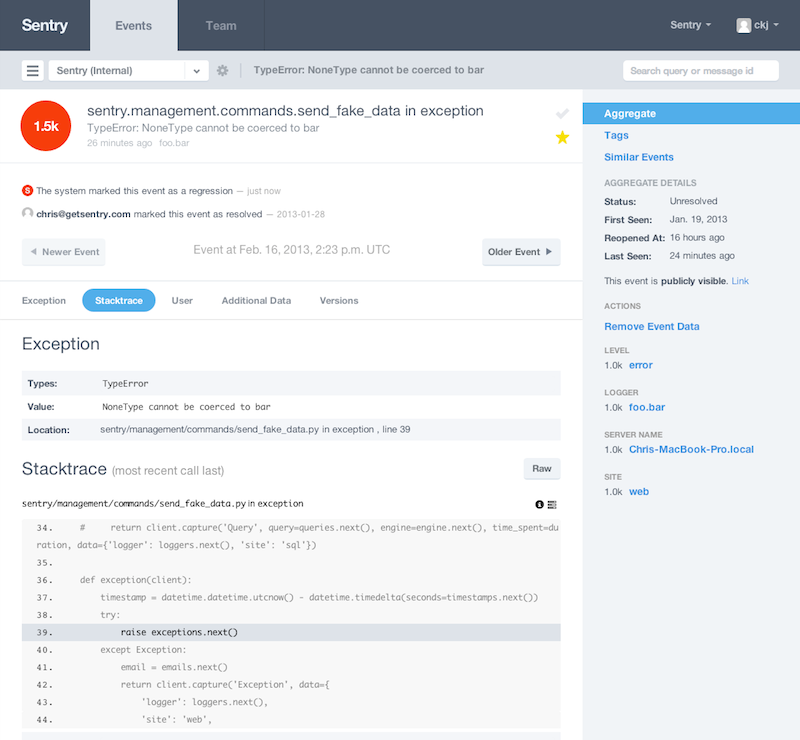
Одинаковые ошибки группируются, таким образом можно наблюдать за «пульсом» проекта и чинить в первую очередь самые критичные места. Ещё один пример использования sentry — логгирование. Можно просто добавить в спорное место запись в лог сообщения с любыми интересующими разработчика переменными, и всё это окажется в sentry.
Но самый большой плюс в том, что всё это можно (и нужно!) использовать в продакшене.
Ещё один интересный отладчик: PuDB представляет собой консольный дебагер с графическим интерфейсом: 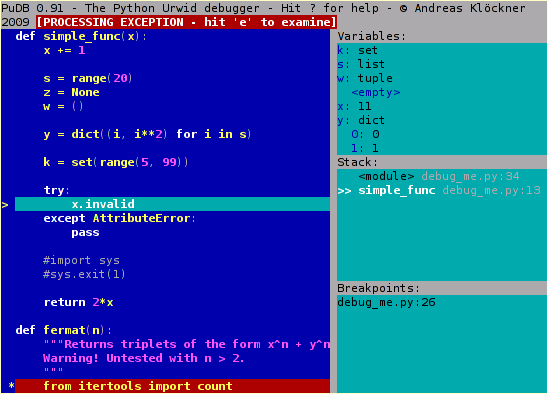
Не буду много о нём писать (честно говоря, я сам активно им не пользовался), предлагаю прочитать короткую заметка на хабре: Удобный отладчик для Python/Django проектов от пользователя int22h или более полный обзор: Отладка Python/Django при помощи PuDB.
Winpdb
Standalone отладчик Python, на этот раз с полноценным графическим интерфейсом: Winpdb: 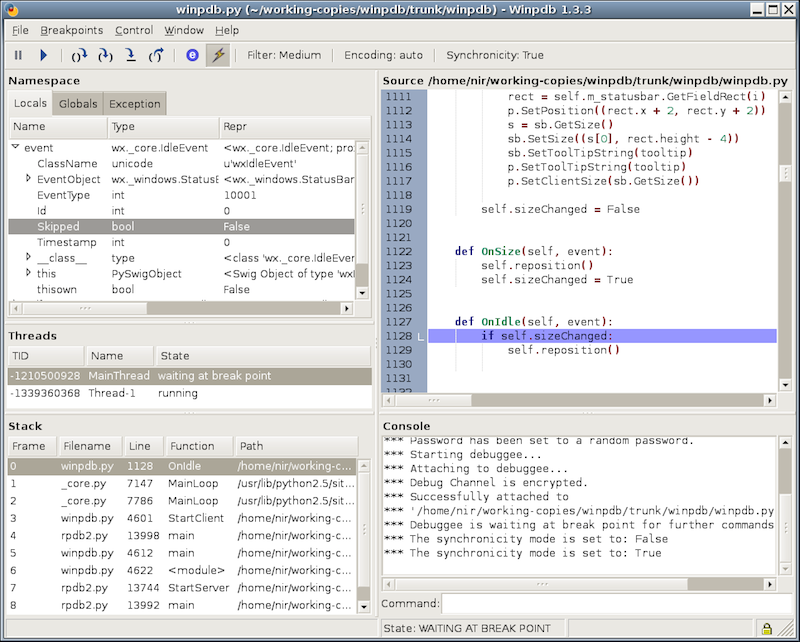
Его разработчики утверждают, что winpdb в 20 раз быстрее pdb, а так же поддерживает работу с тредами. Очень большой и подробный туториал можно найти на этой странице: code.google.com/p/winpdb/wiki/DebuggingTutorial.
Отдельного слова заслуживают универсальные «комбайны» программирования: IDE, которые позволяют не выходя из редактора запустить код, отпрофилировать его или запустить встроенный отладчик. Я, пожалуй, выделю несколько продуктов, предназначенных для разработки на Python: PyCharm, PyDev, Wing IDE и PTVS. 
Если честно, я не вижу особого смысла рассматривать каждую из этих IDE, достаточно знать что они есть, что они успешно справляются со своими задачами и вы можете использовать встроенный отладчик прямо из редактора, — это действительно удобно, круто и здорово.