Different Methods of Calculating Load
Before we dive into Linux load averages, we must explore the different ways load is calculated and address the most common measurement of CPU load – a percentage.
Windows calculates load differently from Linux, and since Windows has been historically more popular on the desktop, the Windows definition of load is generally understood by most computer users. Most Windows users have seen the system load in the task manager displayed as a percentage ranging from 0% to 100%.
In Windows this is derived by examining how “busy” the System Idle Process is and using the inverse to represent the system load. For example, if the idle thread is executing 99% of the time, CPU load in Windows would be 1%. This value is easy to understand but provides less overall detail about the true status of the system.
In Linux, the load average is instead is represented by a decimal number starting at 0.00. The value can be roughly defined as the number of processes over the past minute that had to wait their turn for execution. Unlike Windows, Linux load average is not an instant measurement. Load is given in three values – the one minute average, the five minute average, and the fifteen minute average.
Understanding Load Average in Linux
At first, this extra layer of detail seems unnecessary if you simply want to know the current state of CPU load in your system. But since the averages of three time periods are given, rather than an instant measurement, you can get a more complete idea of the change of system load over time in a single glance of three numbers
Displaying the load average is simple. On the command line, you can use a variety of commands. I simply use the “w” command:
] # w
21 :08: 43 up 38 days, 4 : 34 , 4 users , load average: 3.11 , 2.75 , 2.70
The rest of the command will display who’s logged on and what they’re executing, but for our purposes this information is irrelevant so I’ve clipped it from the above display.
In an ideal system, no process should be held up by another process (or thread), but in a single processor system, this occurs when the load goes above 1.00.
The words “single processor system” are incredibly important here. Unless you’re running an ancient computer, your machine probably has multiple CPU cores. In the machine I’m on, I have 16 cores:
In this case, a load average of 3.11 is not alarming at all. It simply means that a bit more than three processes were ready to execute and CPU cores were present to handle their execution. On this particular system, the load would have to reach 16 to be considered at “100%”.
To translate this to a percent-based system load, you could use this simple, if not obtuse, command:
This command sequences isolates the 1-minute average via cut and echos it, divided by the number of CPU cores, through bc, a command-line calculator, to derive the percentage.
This value is by no means scientific but does provide a rough approximation of CPU load in percent.
A Minute to Learn, a Lifetime to Master
In the previous section I put the “100%” example of a load of 16.0 on a 16 CPU core system in quotes because the calculation of load in Linux is a bit more nebulous than Windows. The system administrator must keep in mind that:
- Load is expressed in waiting processes and threads
- It is not an instantaneous value, rather an average, and
- It’s interpretation must include the number of CPU cores, and
- May over-inflate I/O waits like disk reads
Because of this, getting a handle of CPU load on a Linux system is not entirely an empirical matter. Even if it were, CPU load alone is not an adequate measurement of overall system resource utilization. As such, an experienced Linux administrator will consider CPU load in concert with other values such as I/O wait and the percentage of kernel versus system time.
I/O Wait
I/O wait is most easily seen via the “top” command:
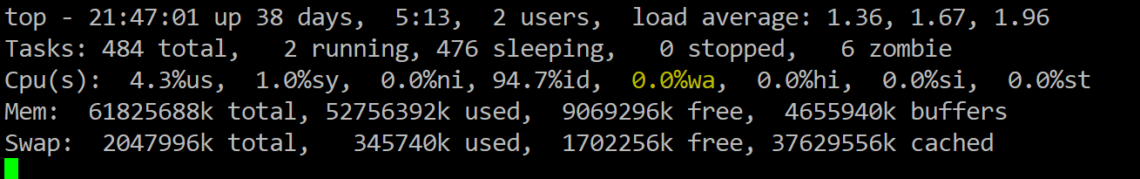
In the screenshot above I have highlighted the I/O wait value. This is a percentage of time that the CPU was waiting on input or output commands to complete. This is usually indicative of high disk activity. While a high wait percentage alone may not significantly degrade CPU-bound tasks, it will reduce I/O performance for other tasks and will make the system feel sluggish.
High I/O wait without any obvious cause might indicate a problem with a disk. Use the “dmesg” command to see if any errors have occurred.
Kernel vs. System Time
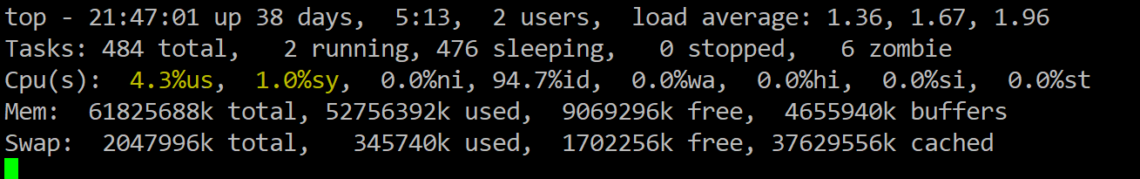
The above highlighted values represent the user and kernel (system) time. This is a breakdown of the overall consumption of CPU time by users (i.e. applications, etc.) and the kernel (i.e. interaction with system devices). Higher user time will indicate more CPU usage by programs where higher kernel time will indicate more system-level processing.
A Fairly Average Load
Learning the relationship of load average to actual system performance takes time, but before long you’ll see a distinct correlation. Armed with the intricacies of system performance metrics, you’ll be able to make better decisions about hardware upgrades and program resource utilization.
Understand Linux Load Averages and Monitor Performance of Linux
In this article, we will explain one of the critical Linux system administration tasks – performance monitoring in regards to system/CPU load and load averages.
Before we move any further, let’s understand these two important phrases in all Unix-like systems:
- System load/CPU Load – is a measurement of CPU over or under-utilization in a Linux system; the number of processes which are being executed by the CPU or in waiting state.
- Load average – is the average system load calculated over a given period of time of 1, 5 and 15 minutes.
In Linux, the load-average is technically believed to be a running average of processes in it’s (kernel) execution queue tagged as running or uninterruptible.
Note that:
- All if not most systems powered by Linux or other Unix-like systems will possibly show the load average values somewhere for a user.
- A downright idle Linux system may have a load average of zero, excluding the idle process.
- Nearly all Unix-like systems count only processes in the running or waiting states. But this is not the case with Linux, it includes processes in uninterruptible sleep states; those waiting for other system resources like disk I/O etc.
How to Monitor Linux System Load Average
There are numerous ways of monitoring system load average including uptime which shows how long the system has been running, number of users together with load averages:
The numbers are read from left to right, and the output above means that:
- load average over the last 1 minute is 1.98
- load average over the last 5 minutes is 2.15
- load average over the last 15 minutes is 2.21
High load averages imply that a system is overloaded; many processes are waiting for CPU time.
We will uncover this in the next section in relation to number of CPU cores. Additionally, we can as well use other well known tools such as top and glances which display a real-time state of a running Linux system, plus many other tools:
Top Command
Glances Tool
The load averages shown by these tools is read /proc/loadavg file, which you can view using the cat command as below:
On desktop machines, there are graphical user interface tools that we can use to view system load averages.
Understanding System Average Load in Relation Number of CPUs
We can’t possibly explain system load or system performance without shedding light on the impact of the number of CPU cores on performance.
Multi-processor Vs Multi-core
- Multi-processor – is where two or more physical CPU’s are integrated into a single computer system.
- Multi-core processor – is a single physical CPU which has at least two or more separate cores (or what we can also refer to as processing units) that work in parallel. Meaning a dual-core has 2 two processing units, a quad-core has 4 processing units and so on.
Furthermore, there is also a processor technology which was first introduced by Intel to improve parallel computing, referred to as hyper threading.
Under hyper threading, a single physical CPU core appears as two logical CPUs core to an operating system (but in reality, there is one physical hardware component).
Note that a single CPU core can only carry out one task at a time, thus technologies such as multiple CPUs/processors, multi-core CPUs and hyper-threading were brought to life.
With more than one CPU, several programs can be executed simultaneously. Present-day Intel CPUs use a combination of both multiple cores and hyper-threading technology.
To find the number of processing units available on a system, we may use the nproc or lscpu commands as follows:
Another way to find the number of processing units using grep command as shown.
Now, to further understand system load, we will take a few assumptions. Let’s say we have load averages below:
On a single core system this would mean:
- The CPU was fully (100%) utilized on average; 1 processes was running on the CPU (1.00) over the last 1 minute.
- The CPU was idle by 60% on average; no processes were waiting for CPU time (0.40) over the last 5 minutes.
- The CPU was overloaded by 235% on average; 2.35 processes were waiting for CPU time (3.35) over the last 15 minutes.
On a dual-core system this would mean:
- The one CPU was 100% idle on average, one CPU was being used; no processes were waiting for CPU time(1.00) over the last 1 minute.
- The CPUs were idle by 160% on average; no processes were waiting for CPU time. (0.40) over the last 5 minutes.
- The CPUs were overloaded by 135% on average; 1.35 processes were waiting for CPU time. (3.35) over the last 15 minutes.
You might also like:
In conclusion, if you are a system administrator then high load averages are real to worry about. When they are high, above the number of CPU cores, it signifies high demand for the CPUs, and low load averages below the number of CPU cores tells us that CPUs are underutilized.
How to Make Sense of Linux System Stats in Top
This is my complete guide to understanding the plethora of CPU, memory and load stats that you can get from your Linux server, using the top command.
If you want to figure out how overworked (or underworked!) your Linux server is, then dive right into this.
top is the first tool I turn to, when I need to investigate a performance issue in Linux. It’s like a Linux command-line equivalent of Windows Task Manager. So, let’s take a look, shall we?
-
: All the top commands on one page: What you need to know
What is ‘top’?
The top program is one of the main system and process monitoring commands on Linux. If you want to get a rough idea of the CPU and memory usage of your system, or see a list of the top processes and programs currently running, run top.
top actually stands for…. Table Of Processes. (So now you know!)
To start top, just type top in a terminal.
top is fairly ubuqitous, so you should find it on most Linux systems. But, if you need to install it yourself for some reason, you can find it in the package procps-ng (on Fedora and RHEL).
Sample output from ‘top’
When you run top, you should see output that looks something like this:
The toppermost of the poppermost: output from the top command
The first section of the screen shows your server stats: server load, CPU, memory usage and your number of tasks or processes.
The second section shows the table of processes (hence the name top!)
In this article, we’ll focus on the overall system health stats in the top section. There are a lot of numbers here. What do they all mean? Let’s dive and try to decipher each set of numbers:
�� Load average
The load average is the figure at the top right of top. It’s a measure of how busy the system is. It is taken by looking at tasks that are running on the CPU, and those that are waiting to run. You get a set of 3 figures, which show the average system load, over the last 1 minute, 5 minutes and 15 minutes:
A real example
The graph below shows the 1, 5 and 15 minute load averages on my (4-CPU) Linux desktop, when I run a load test. I run a process which demands a lot of CPU power, which causes a spike in the 1-minute load average. Then, I stop the process after a few minutes, but I continue to gather metrics. Here are the results:
How 1, 5 and 15 minute load averages relate to each other
As you can see, all 3 averages increase very slowly. The 1-minute load average takes almost 10 minutes to reach 4.0. The 5 and 15 minute load averages increase even more slowly still. So when looking at load average, bear in mind that the figures are a little moderated by time.
How was this graph produced?
This little graph was produced by extracting the load average data over
15 minutes, using this command: awk -v date=»$(date +»%T»)» ‘
Got multiple CPUs?
Load average takes your multiple CPUs into account. So if you have multiple cores (as most modern computers do), you can divide the load average by the number of CPUs, to get the system load as a whole.
For example, if you have a quad-core machine (4 cores), then 100% utilisation for you would mean a load average of 4.00. Ray Walker calls this “perfect utilisation”:
The point of perfect utilization, meaning that the CPUs are always busy and, yet, no process ever waits for one, is the average matching the number of CPUs.
To find out the number of processing units available on your system, you can use the handy command nproc!
System load helps identify trends and their duration
Load average gives you a good idea of whether your Linux server is becoming more or less busy, and how long it has been that way. ��
The load average might seem high on one system, yet it might still feel zippy and responsive. So while load average might not give an exact measure of “busyness”, it will definitely help identify whether your system is getting busier or not.
For example, if the first figure (the 1-minute figure) is higher than the 2nd and 3rd figure, then your system load is increasing, which means your server is getting busier. But, if the first figure is lower than the 2nd and 3rd figures, then your system load is decreasing.
�� Tasks
The next line down in top shows the number of tasks, or processes in the system. (top calls them tasks here.)
Processes in Linux can move between different states, as you can see in this graphic:
Sleeping, running, stopped and zombie processes in Linux
Total — This is the total number of tasks (no further explanation needed!)
Running — These are tasks which are either currently executing, or are queued up, waiting to run.
Sleeping — Tasks sleep when they are waiting for something; often a task needs to wait for a resource like a disk, or network I/O. Most processes running on your system will be in the sleep state for most of the time, then they wake again whenever the resource they were waiting for becomes available. (So lots of sleeping tasks is quite normal.)
Stopped — These are tasks which are paused in a way. You can affect this number by starting a foreground process (e.g. python ) and then pressing Ctrl + Z . This will suspend the python process, and you should see that the count of ‘Stopped’ processes will increase by 1.
top displays tasks by default. But if you want to see threads instead, you can switch to that by pressing Shift + H . A single process can contain multiple threads, so the counts for threads will be higher.
�� CPU usage
The CPU stats in top give you information about what your CPU(s) are up to. It shows you the percentage of time that the computer’s CPUs spent on performing different types of tasks. This data is basically real-time, so the numbers you see are based on the interval since the last screen refresh.
The CPU usage line looks like this:
You can press t to show a different CPU stats view, which shows the combined percentage of nice and un-niced user processes; the system percentage; the total usage; and a small text-based gauge.
�� Memory
In top, memory is displayed in “MiB” or mebibytes. 1 mebibyte equals 1,048,576 bytes, which is 1024 x 1024 bytes.
Total — your total installed memory
Free — This shows memory which is totally unused. On a typical Linux system, this will be quite low, because the kernel uses free memory to cache files (see the “buff/cache” definition)
Used — Memory which is being used
Total
Free
Used
Advertisements How to run a load test with stress-ng
You’ve learned about the basics, so how about seeing how your system reacts under load?
To understand the stats in top further, you can run a test program which consumes a lot of CPU or memory. The stress-ng package will help you do it.
stress-ng can help you to stress-test a Linux system in various ways. You can get it using your package manager, so you can install it with apt-get or yum/dnf, depending on your system. Advertisements
Once you’ve installed stress-ng, you can create a process which starts a worker that continuously writes to 500 Megabytes of memory:
top will help you see memory and CPU utilisation, which gives you an idea of how your workloads are doing. However, if you’ve got performance issues, you might need to investigate further.
But it doesn’t easily tell you whether your CPU is saturated, which is when your memory and CPU are at capacity, and there are still other tasks waiting to be done.
Further reading
Linux Memory Management FAQ (archive of gentoo-wiki.com) — This FAQ, archived by archive.org (the original domain name is now sadly occupied by some spammy nonsense), answers some common questions about how Linux manages memory.
USE Method Linux Performance Checklist — this cheatsheet of Linux commands gives you all sorts of metrics about utilisation and saturation, which can help you to diagnose bottlenecks and other performance niggles.
Linux Ate My Ram — a funny reminder to not be worried when you see your “free” memory looking low in Linux
By Tom Donohue, Editor | Twitter | LinkedIn
Tom is the founder of Tutorial Works. He’s an engineer and open source advocate. He uses the blog as a vehicle for sharing tutorials, writing about technology and talking about himself in the third person. His very first computer was an Acorn Electron.
Thanks for reading. Let’s stay in touch.
It took us this long to find each other. So before you close your browser and forget all about this article, shall we stay in touch?
Join our free members’ newsletter. We’ll email you our latest tutorials and guides, so you can read at your leisure! �� (No spam, unsubscribe whenever you want.)
Thank you!
We’ve sent you an email. Please check your email, and click the link inside to confirm your subscription.
Want more? Read these articles next.
Run a web server in a Linux VM with Vagrant [Learning Project]: Learn Linux and virtualisation basics by deploying a website in this tutorial.
What is Linux?: Understand what Linux is, and the fundamental parts you should know about.
The Best Places to Learn & Try Kubernetes Online: Learning Kubernetes can seem challenging. But fear not! Here’s a boatload of resources that will help you get there.
Spring Boot app metrics — with Prometheus and Micrometer: How to configure and publish metrics from your application, and define your own custom metrics
You might also like.
Advertisements  report this ad Advertisements
Tutorial Works is a website to help you navigate the world of IT, and grow your tech career, with tips, tutorials, guides, and real opinions.
Thanks for being here today! ��
Copyright © 2022 Tom Donohue. All rights reserved, except where stated. You can use our illustrations on your own blog, as long as you include a link back to us.
htop explained
For the longest time I did not know what everything meant in htop.
I thought that load average 1.0 on my two core machine means that the CPU usage is at 50%. That's not quite right. And also, why does it say 1.0 ?
I decided to look everything up and document it here.
They also say that the best way to learn something is to try to teach it.
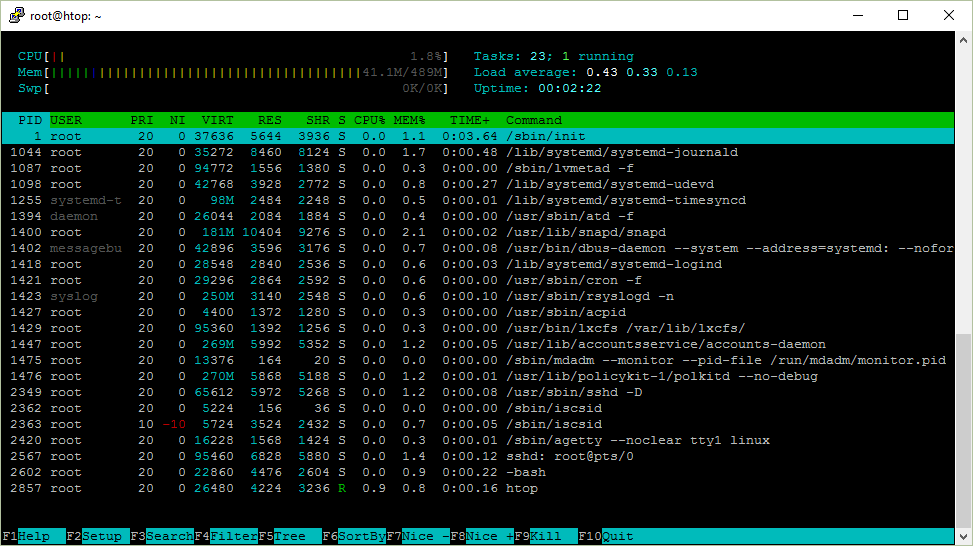
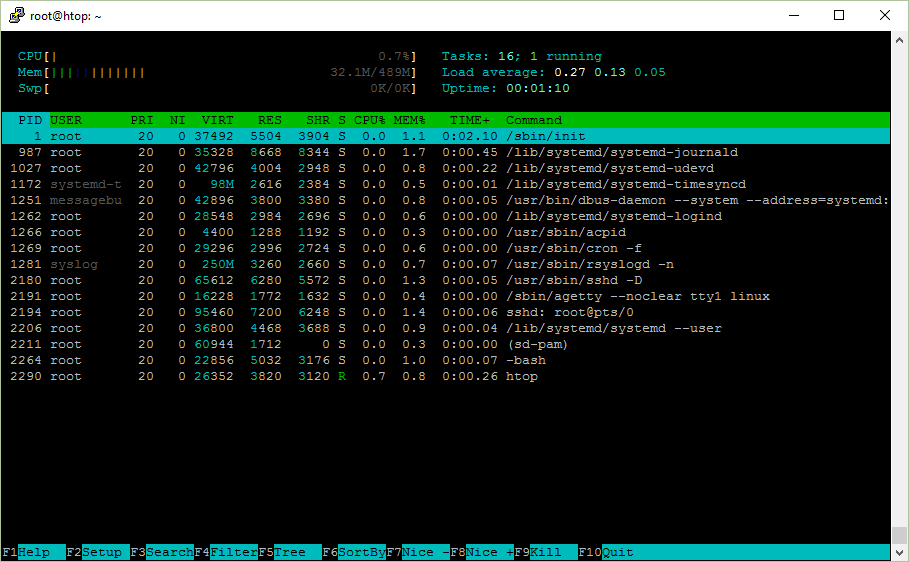
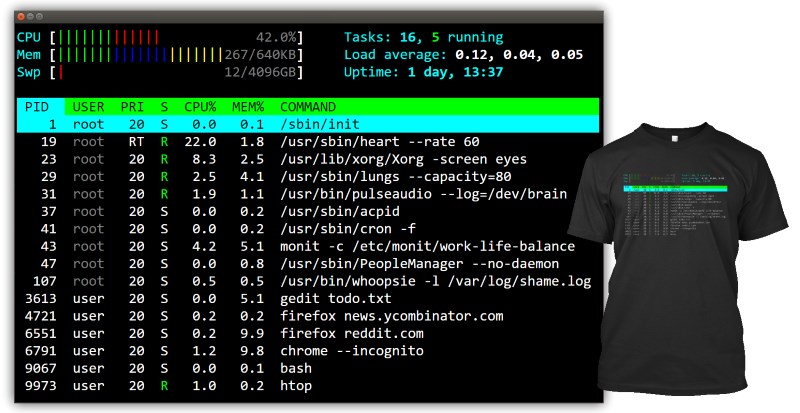
Here is a screenshot of htop that I am going to describe.
Uptime shows how long the system has been running.
You can see the same information by running uptime :
How does the uptime program know that?
It reads the information from the file /proc/uptime .
The first number is the total number of seconds the system has been up. The second number is how much of that time the machine has spent idle, in seconds The second value may be greater than the overall system uptime on systems with multiple cores since it is a sum.
How did I know that? I looked at what files the uptime program opens when it is run. We can use the strace tool to do that.
There will be a lot of output. We can grep for the open system call. But that will not really work since strace outputs everything to the standard error (stderr) stream. We can redirect the stderr to the standard output (stdout) stream with 2>&1 .
Our output is this:
which contains the file /proc/uptime which I mentioned.
It turns out that you can also use strace -e open uptime and not bother with grepping.
So why do we need the uptime program if we can just read the contents of the file? The uptime output is nicely formatted for humans whereas the number of seconds is more useful for using in your own programs or scripts.
In addition to uptime, there were also three numbers that represent the load average.
They are taken from the /proc/loadavg file. If you take another look at the strace output, you'll see that this file was also opened.
The first three columns represent the average system load of the last 1, 5, and 15 minute periods. The fourth column shows the number of currently running processes and the total number of processes. The last column displays the last process ID used.
Let's start with the last number.
Whenever you launch a new process, it is assigned an ID number. Process IDs are usually increasing, unless they've been exausted and are being reused. The process ID of 1 belongs to /sbin/init which is started at boot time.
Let's look at the /proc/loadavg contents again and then launch the sleep command in the background. When it's launched in the background, its process ID will be shown.
So the 1/123 means that there is one process running or ready to run at this time and there are 123 processed in total.
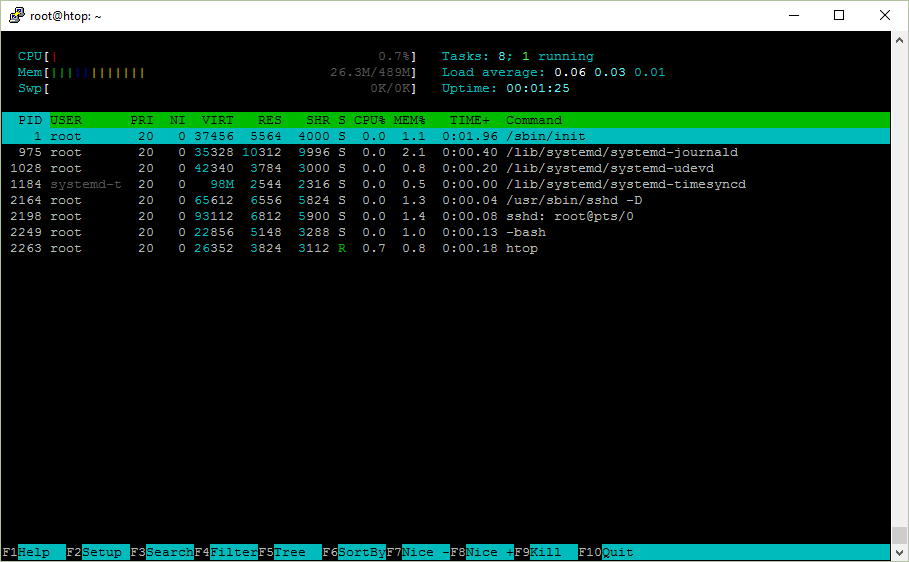
When you run htop and see just one running process, it means that it is the htop process itself.
If you run sleep 30 and run htop again, you'll notice that there is still just 1 running process. That's because sleep is not running, it is sleeping or idling or in other words waiting for something to happen. A running process is a process that is currently running on the physical CPU or waiting its turn to run on the CPU.
If you run cat /dev/urandom > /dev/null which repeatedly generates random bytes and writes them to a special file that is never read from, you will see that there are now two running process.
So there are now two running processes (random number generation and the cat that reads the contents of /proc/loadavg ) and you'll also notice that the load averages have increased.
The load average represents the average system load over a period of time.
The load number is calculated by counting the number of running (currently running or waiting to run) and uninterruptible processes (waiting for disk or network activity). So it's simply a number of processes.
The load averages are then the average number of those processes during the last 1, 5 and 15 minutes, right?
It turns out it's not as simple as that.
The load average is the exponentially damped moving average of the load number. From Wikipedia:
Mathematically speaking, all three values always average all the system load since the system started up. They all decay exponentially, but they decay at different speed. Hence, the 1-minute load average will add up 63% of the load from last minute, plus 37% of the load since start up excluding the last minute. Therefore, it's not technically accurate that the 1-minute load average only includes the last 60 seconds activity (since it still includes 37% activity from the past), but that includes mostly the last minute.
Is that what you expected?
Let's return to our random number generation.
While technically not correct, this is how I simplify load averages to make it easier to reason about them.
In this case, the random number generation process is CPU bound, so the load average over the last minute is 1.00 or on average 1 running process.
Since there is only one CPU on my system, the CPU utilization is 100% since my CPU can run only one process at a time.
If I had two cores, my CPU usage would be 50% since my computer can run two processes at the same time. The load average of a computer with 2 cores that has a 100% CPU utilization would be 2.00 .
You can see the number of your cores or CPUs in the top left corner of htop or by running nproc .
Because the load number also includes processes in uninterruptible states which don't have much effect on CPU utilization, it's not quite correct to infer CPU usage from load averages like I just did. This also explains why you may see high load averages but not much load on the CPU.
But there are tools like mpstat that can show the instantaneous CPU utilization.
Why do we use load averages then?
In the top right corner, htop shows the total number of processes and how many of them are running. But it says Tasks not processes. Why?
Another name for a process is a task. The Linux kernel internally refers to processes as tasks. htop uses Tasks instead of Processes probably because it's shorter and saves some screen space.
You can also see threads in htop . To toggle the visibility of threads, hit Shift + H on your keyboard. If you see Tasks: 23, 10 thr , it means it they are visible.
You can also see kernel threads with Shift + K . When they are visible, it'll say Tasks: 23, 40 kthr .
Every time a new process is started it is assigned an identification number (ID) which is called process ID or PID for short.
If you run a program in the background ( & ) from bash , you will see the job number in square brackets and the PID.
If you missed it, you can use the $! variable in bash that will expand to the last backgrounded process ID.
Process ID is very useful. It can be used to see details about the process and to control it.
procfs is a pseudo file system that lets userland programs to get information from the kernel by reading files. It is usually mounted at /proc/ and to you it looks like a regular directory that you can browse with ls and cd .
All information related to a process is located at /proc/<pid>/ .
For example, /proc/<pid>/cmdline will give the command that was used to launch the process.
Ugh, that's not right. It turns out that the command is separated by the \0 byte.
which we can replace with a space or newline
The process directory for a process can contain links! For instance, cwd points to the current working directory and exe is the executed binary.
So this is how htop , top , ps and other diagnostic utilities get their information about the details of a process: they read it from /proc/<pid>/<file> .
When you launch a new process, the process that launched the new process is called the parent process. The new process is now a child process for the parent process. These relationships form a tree structure.
If you hit F5 in htop , you can see the process hierarchy.
You can also use the f switch with ps
If you have ever wondered why you often see bash or sshd as parents of some of your processes, here's why.
This is what happens when you run, say, date from your bash shell:
- bash creates a new process that is a copy of itself (using a fork system call)
- it will then load the program from the executable file /bin/date into memory (using an exec system call)
- bash as the parent process will wait for its child to exit
So the /sbin/init with an ID of 1 was started at boot, which spawned the SSH daemon sshd . When you connect to the computer, sshd will spawn a process for the session which in turn will launch the bash shell.
I like to use this tree view in htop when I'm also interested in seeing all threads.
Each process is owned by a user. Users are represented with a numeric ID.
You can use the id command to find out the name for this user.
It turns out that id gets this information from the /etc/passwd and /etc/group files.
That's because the Name Service Switch (NSS) configuration file /etc/nsswitch.conf says to use these files to resolve names.
The value of compat (Compatibility mode) is the same as files except other special entries are permitted. files means that the database is stored in a file (loaded by libnss_files.so ). But you could also store your users in other databases and services or use Lightweight Directory Access Protocol (LDAP), for example.
/etc/passwd and /etc/group are plain text files that map numeric IDs to human readable names.
passwd ? But where are the passwords?
They are actually in /etc/shadow .
What's that gibberish?
- $6$ is the password hashing algorithm used, in this case it stands for sha512
- followed by randomly generated salt to safeguard against rainbow table attacks
- and finally the hash of your password + salt
When you run a program, it will be run as your user. Even if the executable file is not owned by you.
If you'd like to run a program as root or another user, that's what sudo is for.
But what if you want to log in as another user to launch various commands? Use sudo bash or sudo -u user bash . You'll be able to use the shell as that user.
If you don't like being asked for the root password all the time, you can simply disable it by adding your user to the /etc/sudoers file.
Right, only root can do it.
What happens here is that you are executing the echo command as root but appending the line to the /etc/sudoers file still as your user.
There are usually two ways around it:
- echo "$USER ALL=(ALL) NOPASSWD: ALL" | sudo tee -a /etc/sudoers
- sudo bash -c "echo '$USER ALL=(ALL) NOPASSWD: ALL' >> /etc/sudoers"
In the first case, tee -a will append its standard input to the file and we execute this command as root.
In the second case, we run bash as root and ask it to execute a command ( -c ) and the entire command will be executed as root. Note the tricky " / ' business here which will dictate when the $USER variable will be expanded.
If you take a look at the /etc/sudoers file you will see that it begins with
It's a helpful warning that says you should edit this file with sudo visudo . It will validate the contents of the file before saving and prevent you from making mistakes. If you don't use visudo and make a mistake, it may lock you out from sudo . Which means that you won't be able to correct your mistake!
Let's say you want to change your password. You can do it with the passwd command. It will, as we saw earlier, save the password to the /etc/shadow file.
This file is sensitive and only writeable by root:
So how is it possible that the passwd program which is executed by a regular user can write to a protected file?
I said earlier that when you launch a process, it is owned by you, even if the owner of the executable file is another user.
It turns out that you can change that behavior by changing file permissions. Let's take a look.
Notice the s letter. It was accomplished with sudo chmod u+s /usr/bin/passwd . It means that an executable will be launched as the the owner of the file which is root in this case.
You can find the so called setuid executables with find /bin -user root -perm -u+s .
Note that you can also do the same with group ( g+s ).
We are next going to look at the process state column in htop which is denoted simply with the letter S .
Here are the possible values:
I've ordered them by how often I see them.
Note that when you run ps , it will also show substates like Ss , R+ , Ss+ , etc.
In this state, the process is currently running or on a run queue waiting to run.
What does it mean to run?
When you compile the source code of a program that you've written, that machine code is CPU instructions. It is saved to a file that can be executed. When you launch a program, it is loaded into memory and then the CPU executes these instructions.
Basically it means that the CPU is physically executing instructions. Or, in other words, crunching numbers.
This means that the code instructions of this process are not being executed on the CPU. Instead, this process is waiting for something — an event or a condition — to happen. When an event happens, the kernel sets the state to running.
One example is the sleep utily from coreutils. It will sleep for a specific number of seconds (approximately).
So this is interruptible sleep. How can we interrupt it?
By sending a signal.
You can send a signal in htop by hitting F9 and then choosing one of the signals in the menu on the left.
Sending a signal is also known as kill . That's because kill is a system call that can send a signal to a process. There is a program /bin/kill that can make this system call from userland and the default signal to use is TERM which will ask the process to terminate or in other words try to kill it.
Signal is just a number. Numbers are hard to remember so we give them names. Signal names are usually written in uppercase and may be prefixed with SIG .
Some commonly used signals are INT , KILL , STOP , CONT , HUP .
Let's interrupt the sleep process by sending the INT aka SIGINT aka 2 aka Terminal interrupt signal.
This is also what happens When you hit CTRL + C on your keyboard. bash will the send the foreground process the SIGINT signal just like we just did manually.
By the way, in bash , kill is a built-in command, even though there is /bin/kill on most systems. Why? It allows processes to be killed if the limit on processes that you can create is reached.
These commands do the same thing:
- kill -INT 10089
- kill -2 10089
- /bin/kill -2 10089
Another useful signal to know is SIGKILL aka 9 . You may have used it to kill a process that didn't respond to your frantic CTRL + C keyboard presses.
When you write a program, you can set up signal handlers that are functions that will be called when your process receives a signal. In other words, you can catch the signal and then do something, for example, clean up and shut down gracefully. So sending SIGINT (the user wants to interrupt a process) and SIGTERM (the user wants to terminate the process) does not mean that the process will be terminated.
You may have seen this exception when running Python scripts:
You can tell the kernel to forcefully terminate a process and not give it a change to respond by sending the KILL signal:
Unlike interruptible sleep, you cannot wake up this process with a signal. That is why many people dread seeing this state. You can't kill such processes because killing means sending SIGKILL signals to processes.
This state is used if the process must wait without interruption or when the event is expected to occur quickly. Like reading to/from a disk. But that should only happen for a fraction of a second.
Uninterruptable processes are USUALLY waiting for I/O following a page fault. The process/task cannot be interrupted in this state, because it can't handle any signals; if it did, another page fault would happen and it would be back where it was.
In other words, this could happen if you are using Network File System (NFS) and it takes a while to read and write from it.
Or in my experience it can also mean that some of the processes are swapping a lot which means you have too little available memory.
Let's try to get a process to go into uninterruptible sleep.
8.8.8.8 is a public DNS server provided by Google. They do not have an open NFS on there. But that won't stop us.
How to find out what's causing this? strace !
Let's strace the command in the output of ps above.
So the mount system call is blocking the process.
If you're wondering, you can run mount with an intr option to run as interruptible: sudo mount 8.8.8.8:/tmp /tmp -o intr .
When a process ends via exit and it still has child processes, the child processes become zombie processes.
- If zombie processes exist for a short time, it is perfectly normal
- Zombie processes that exist for a long time may indicate a bug in a program
- Zombie processes don't consume memory, just a process ID
- You can't kill a zombie process
- You can ask nicely the parent process to reap the zombies (the SIGCHLD signal)
- You can kill the zombie's parent process to get rid of the parent and its zombies
I am going to write some C code to show this.
Here is our program.
Let's install the GNU C Compiler (GCC).
Compile it and then run it
Look at the process tree
We got our zombie!
When the parent process is done, the zombie is gone.
If you replaced sleep(20) with while (true) ; then the zombie would be gone right away.
With exit , all of the memory and resources associated with it are deallocated so they can be used by other processes.
Why keep the zombie processes around then?
The parent process has the option to find out its child process exit code (in a signal handler) with the wait system call. If a process is sleeping, then it needs to wait for it to wake up.
Why not simply forcefully wake it up and kill it? For the same reason, you don't toss your child in the trash when you're tired of it. Bad things could happen.
I have opened two terminal windows and I can look at my user's processes with ps u .
I will omit the -bash and ps u processes from the output below.
Now run cat /dev/urandom > /dev/null in one terminal window. Its state is R+ which means that it is running.
Press CTRL + Z to stop the process.
Its state is now T .
Run fg in the first terminal to resume it.
Another way to stop a process like this is to send the STOP signal with kill to the process. To resume the execution of the process, you can use the CONT signal.
First, install the GNU Debugger (gdb)
Run a program that will listen for incoming network connections on port 1234.
It is sleeping meaning it is waiting for data from the network.
Run the debugger and attach it to the process with ID 3905 .
You will see that the state is t which means that this process is being traced in the debugger.
Linux is a multitasking operating system which means that even when you have a single CPU, you can run several processes at the same time. You can connect to your server via SSH and look at the output of htop while your web server is delivering the content of your blog to your readers over the internet.
How is that possible when a single CPU can only execute one instruction at a time?
The answer is time sharing.
One process runs for a bit of time, then it is suspended while the other processes waiting to run take turns running for a while. The bit of time a process runs is called the time slice.
The time slice is usually a few milliseconds so you don't really notice it that much when your system is not under high load. (It'd be really interesting to find out how long time slices usually are in Linux.)
This should help explain why the load average is the average number of running processes. If you have just one core and the load average is 1.0 , the CPU has been utilized at 100%. If the load average is higher than 1.0 , it means that the number of processes wanting to run is higher than the CPU can run so you may experience slow downs or delays. If the load is lower than 1.0 , it means the CPU is sometimes idleing and not doing anything.
This should also give you a clue why sometimes the running time of a process that's been running for 10 seconds is higher or lower than exactly 10 seconds.
When you have more tasks to run than the number of available CPU cores, you somehow have to decide which tasks to run next and which ones to keep waiting. This is what the task scheduler is responsible for.
The scheduler in the Linux kernel is reponsible for choosing which process on a run queue to pick next and it depends on the scheduler algorithm used in the kernel.
You can't generally influence the scheduler but you can let it know which processes are more important to you and the scheduler may take it into account.
Niceness ( NI ) is user-space priority to processes, ranging from -20 which is the highest priority to 19 which is the lowest priority. It can be confusing but you can think that a nice process yields to a less nice process. So the nicer a process is, the more it yields.
From what I've pieced together by reading StackOverflow and other sites, a niceness level increase by 1 should yield a 10% more CPU time to the process.
The priority ( PRI ) is the kernel-space priority that the Linux kernel is using. Priorities range from 0 to 139 and the range from 0 to 99 is real time and 100 to 139 for users.
You can change the nicesness and the kernel takes it into account but you cannot change the priority.
The relation between the nice value and priority is:
so the value of PR = 20 + (-20 to +19) is 0 to 39 that maps 100 to 139.
You can set the niceness of a process before launching it.
Change the nicencess when a program is already running with renice .
Here is what the CPU usage colors mean:
- Blue: Low priority threads (nice > 0)
- Green: Normal priority threads
- Red: Kernel threads
A process has the illusion of being the only one in memory. This is accomplished by using virtual memory.
A process does not have direct access to the physical memory. Instead, it has its own virtual address space and the kernel translates the virtual memory addresses to physical memory or can map some of it to disk. This is why it can look like processes use more memory than you have installed on your computer.
The point I want to make here is that it is not very straightforward to figure out how much memory a process takes up. Do you also want to count the shared libraries or disk mapped memory? But the kernel provides and htop shows some information that can help you estimate memory usage.
Here is what the memory usage colors mean:
- Green: Used memory
- Blue: Buffers
- Orange: Cache
The total amount of virtual memory used by the task. It includes all code, data and shared libraries plus pages that have been swapped out and pages that have been mapped but not used.
VIRT is virtual memory usage. It includes everything, including memory mapped files.
If an application requests 1 GB of memory but uses only 1 MB, then VIRT will report 1 GB. If it mmap s a 1 GB file and never uses it, VIRT will also report 1 GB.
Most of the time, this is not a useful number.
The non-swapped physical memory a task has used.
RES is resident memory usage i.e. what's currently in the physical memory.
While RES can be a better indicator of how much memory a process is using than VIRT , keep in mind that
- this does not include the swapped out memory
- some of the memory may be shared with other processes
If a process uses 1 GB of memory and it calls fork() , the result of forking will be two processes whose RES is both 1 GB but only 1 GB will actually be used since Linux uses copy-on-write.
The amount of shared memory used by a task. It simply reflects memory that could be potentially shared with other processes.
TODO: I should finish this.
A task's currently used share of available physical memory.
This is RES divided by the total RAM you have.
If RES is 400M and you have 8 gigabytes of RAM, MEM% will be 400/8192*100 = 4.88% .
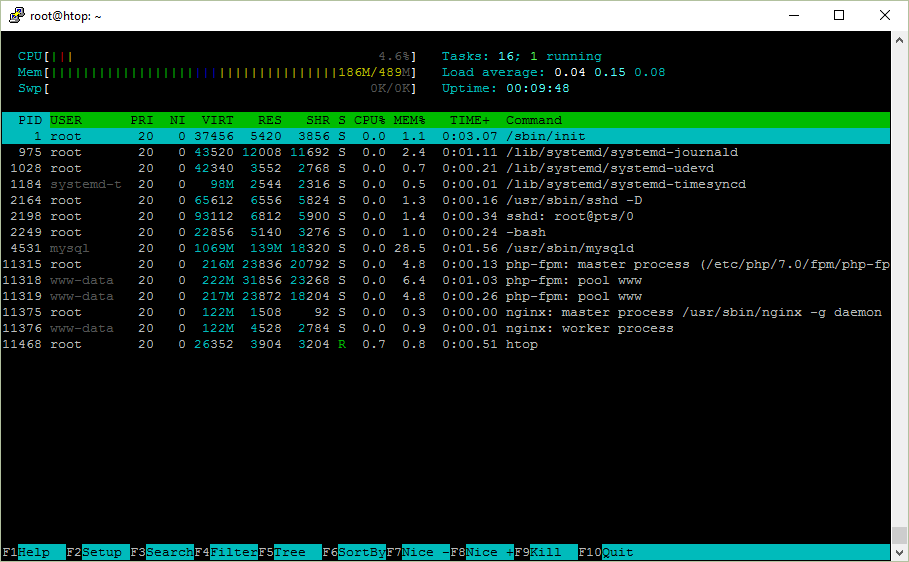
Let's take a look at the process list in the htop screenshot.
Do you actually need them?
Here are my research notes on the processes that are run at startup on a fresh Digital Ocean droplet with Ubuntu Server 16.04.1 LTS x64.
The /sbin/init program (also called init) coordinates the rest of the boot process and configures the environment for the user.
When the init command starts, it becomes the parent or grandparent of all of the processes that start up automatically on the system.
What happens if you kill it?
systemd-journald is a system service that collects and stores logging data. It creates and maintains structured, indexed journals based on logging information that is received from a variety of sources.
One of the main changes in journald was to replace simple plain text log files with a special file format optimized for log messages. This file format allows system administrators to access relevant messages more efficiently. It also brings some of the power of database-driven centralized logging implementations to individual systems.
You are supposed to use the journalctl command to query log files.
- journalctl _COMM=sshd logs by sshd
- journalctl _COMM=sshd -o json-pretty logs by sshd in JSON
- journalctl —since "2015-01-10" —until "2015-01-11 03:00"
- journalctl —since 09:00 —until "1 hour ago"
- journalctl —since yesterday
- journalctl -b logs since boot
- journalctl -f to follow logs
- journalctl —disk-usage
- journalctl —vacuum-size=1G
It looks like it is not possible to remove or disable this service, you can only turn off logging.
The lvmetad daemon caches LVM metadata, so that LVM commands can read metadata without scanning disks.
Metadata caching can be an advantage because scanning disks is time consuming and may interfere with the normal work of the system and disks.
But what is LVM (Logical Volume Management)?
You can think of LVM as "dynamic partitions", meaning that you can create/resize/delete LVM "partitions" (they're called "Logical Volumes" in LVM-speak) from the command line while your Linux system is running: no need to reboot the system to make the kernel aware of the newly-created or resized partitions.
It sounds like you should keep it if you are using LVM.
systemd-udevd listens to kernel uevents. For every event, systemd-udevd executes matching instructions specified in udev rules.
udev is a device manager for the Linux kernel. As the successor of devfsd and hotplug, udev primarily manages device nodes in the /dev directory.
So this service manages /dev .
I am not sure if I need it running on a virtual server.
systemd-timesyncd is a system service that may be used to synchronize the local system clock with a remote Network Time Protocol server.
So this replaces ntpd .
If we take a look at the open ports on this server:
Previously on Ubuntu 14.04 it was
atd — run jobs queued for later execution. atd runs jobs queued by at.
at and batch read commands from standard input or a specified file which are to be executed at a later time
Unlike cron, which schedules jobs that are repeated periodically, at runs a job at a specific time once.
I've actually never used it until now.
Snappy Ubuntu Core is a new rendition of Ubuntu with transactional updates — a minimal server image with the same libraries as today’s Ubuntu, but applications are provided through a simpler mechanism.
Developers from multiple Linux distributions and companies today announced collaboration on the “snap” universal Linux package format, enabling a single binary package to work perfectly and securely on any Linux desktop, server, cloud or device.
Apparently it is a simplified deb package and you're supposted to bundle all dependencies in a single snap that you can distribute.
I've never used snappy to deploy or distribute applications on servers.
In computing, D-Bus or DBus is an inter-process communication (IPC) and remote procedure call (RPC) mechanism that allows communication between multiple computer programs (that is, processes) concurrently running on the same machine
My understanding is that you need it for desktop environments but on a server to run web apps?
I wonder what time it is and whether it is being synchronized with NTP?
Oops. Should probably keep this.
systemd-logind is a system service that manages user logins.
cron — daemon to execute scheduled commands (Vixie Cron)
-f Stay in foreground mode, don't daemonize.
You can schedule tasks to run periodically with cron.
Use crontab -e to edit the configuration for your user or on Ubuntu I tend to use the /etc/cron.hourly , /etc/cron.daily , etc. directories.
You can see the log files with
- grep cron /var/log/syslog or
- journalctl _COMM=cron or even
- journalctl _COMM=cron —since="date" —until="date"
You'll probably want to keep cron.
But if you don't, then you should stop and disable the service:
Because otherwise when trying to remove it with apt remove cron it will try to install postfix!
It looks like cron needs a mail transport agent (MTA) to send emails.
Rsyslogd is a system utility providing support for message logging.
In another words, it's what populates log files in /var/log/ like /var/log/auth.log for authentication messages like SSH login attempts.
The configuration files are in /etc/rsyslog.d .
You can also configure rsyslogd to send log files to a remote server and implement centralized logging.
You can use the logger command to log messages to /var/log/syslog in background scripts such as those that are run at boot.
Right, but we already have systemd-journald running. Do we need rsyslogd as well?
Rsyslog and Journal, the two logging applications present on your system, have several distinctive features that make them suitable for specific use cases. In many situations it is useful to combine their capabilities, for example to create structured messages and store them in a file database. A communication interface needed for this cooperation is provided by input and output modules on the side of Rsyslog and by the Journal's communication socket.
So, maybe? I am going to keep it just in case.
acpid — Advanced Configuration and Power Interface event daemon
acpid is designed to notify user-space programs of ACPI events. acpid should be started during the system boot, and will run as a background process, by default.
In computing, the Advanced Configuration and Power Interface (ACPI) specification provides an open standard that operating systems can use to perform discovery and configuration of computer hardware components, to perform power management by, for example, putting unused components to sleep, and to do status monitoring.
But I'm on a virtual server that I don't intend to suspend/resume.
I am going to remove it for fun and see what happens.
I was able to successfully reboot the droplet but after halt Digital Ocean thought it was still on so I had to Power Off using the web interface.
So I should probably keep this.
Lxcfs is a fuse filesystem mainly designed for use by lxc containers. On a Ubuntu 15.04 system, it will be used by default to provide two things: first, a virtualized view of some /proc files; and secondly, filtered access to the host’s cgroup filesystems.
In summary, on a 15.04 host, you can now create a container the usual way, lxc-create . The resulting container will have “correct” results for uptime, top, etc.
It’s basically a userspace workaround to changes which were deemed unreasonable to do in the kernel. It makes containers feel much more like separate systems than they would without it.
Not using LXC containers? You can remove it with
The AccountsService package provides a set of D-Bus interfaces for querying and manipulating user account information and an implementation of these interfaces based on the usermod(8), useradd(8) and userdel(8) commands.
When I removed DBus it broke timedatectl , I wonder what removing this service will break.
mdadm is a Linux utility used to manage and monitor software RAID devices.
The name is derived from the md (multiple device) device nodes it administers or manages, and it replaced a previous utility mdctl. The original name was "Mirror Disk", but was changed as the functionality increased.
RAID is a method of using multiple hard drives to act as one. There are two purposes of RAID: 1) Expand drive capacity: RAID 0. If you have 2 x 500 GB HDD then total space become 1 TB. 2) Prevent data loss in case of drive failure: For example RAID 1, RAID 5, RAID 6, and RAID 10.
You can remove it with
polkit — Authorization Framework
My understanding is that this is like fine-grained sudo. You can allow non privilegded users to do certain actions as root. For instance, reboot your computer when you're running Linux on a desktop computer.
But I'm running a server. You can remove it with
Still wondering if this breaks something.
sshd (OpenSSH Daemon) is the daemon program for ssh.
-D When this option is specified, sshd will not detach and does not become a daemon. This allows easy monitoring of sshd.
iscsid is the daemon (system service) that runs in the background, acting on iSCSI configuration, and managing the connections. From its manpage:
The iscsid implements the control path of iSCSI protocol, plus some management facilities. For example, the daemon could be configured to automatically re-start discovery at startup, based on the contents of persistent iSCSI database.
I had never heard of iSCSI:
In computing, iSCSI (Listeni/aɪˈskʌzi/ eye-skuz-ee) is an acronym for Internet Small Computer Systems Interface, an Internet Protocol (IP)-based storage networking standard for linking data storage facilities.
By carrying SCSI commands over IP networks, iSCSI is used to facilitate data transfers over intranets and to manage storage over long distances. iSCSI can be used to transmit data over local area networks (LANs), wide area networks (WANs), or the Internet and can enable location-independent data storage and retrieval.
The protocol allows clients (called initiators) to send SCSI commands (CDBs) to SCSI storage devices (targets) on remote servers. It is a storage area network (SAN) protocol, allowing organizations to consolidate storage into data center storage arrays while providing hosts (such as database and web servers) with the illusion of locally attached disks.
You can remove it with
agetty — alternative Linux getty
getty, short for "get tty", is a Unix program running on a host computer that manages physical or virtual terminals (TTYs). When it detects a connection, it prompts for a username and runs the 'login' program to authenticate the user.
Originally, on traditional Unix systems, getty handled connections to serial terminals (often Teletype machines) connected to a host computer. The tty part of the name stands for Teletype, but has come to mean any type of text terminal.
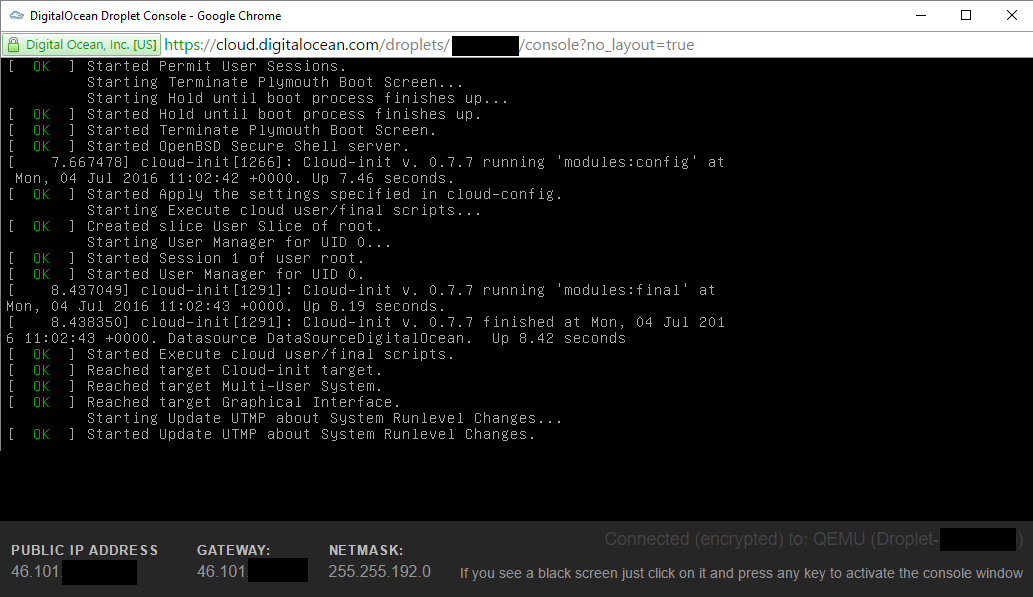
This allows you to log in when you are physically at the server. In Digital Ocean, you can click on Console in the droplet details and you will be able to interact with this terminal in your browser (it's a VNC connection I think).
In the old days, you'd see a bunch of ttys started a system boot (configured in /etc/inittab ), but nowadays they are spun up on demand by systemd.
For fun, I removed this configuration file that launches and generates agetty :
When I rebooted the server, I could still connect to it via SSH but I was no longer able to log in from the Digital Ocean web console.
sshd: [email protected]/0 means that there has been an SSH session established for the user root at the # 0 pseudoterminal ( pts ). A pseudoterminal emulates a real text terminal.
bash is the shell that I am using.
Why is there a dash at the beginning? Reddit user hirnbrot helpfully explained it:
There's a dash at the beginning because launching it as "-bash" will make it a login shell. A login shell is one whose first character of argument zero is a -, or one started with the —login option. This will then cause it to read a different set of configuration files.
htop is an interactive process viewer tool that is running in the screenshot.
I followed the instructions in my blog post about unattended installation of WordPress on Ubuntu Server and it works.
Here's nginx, PHP7 and MySQL.
Sometimes looking at strace is not enough.
Another way to figure out what a program does is to look at its source code.
First, I need to find out where to start looking.
Here we find out that uptime is actually located at /usr/bin/uptime and that on Ubuntu it is part of the procps package.
You can then go to packages.ubuntu.com and search for the package there.
If you scroll to the bottom of the page, you'll see links to the source code repositories:
- Debian Package Source Repository git://git.debian.org/collab-maint/procps.git
- Debian Package Source Repository (Browsable) https://anonscm.debian.org/cgit/collab-maint/procps.git/
When you want to redirect standard error (stderr) to standard output (stdout), is it 2&>1 or 2>&1 ?
You can memorize where the ampersand & goes by knowing that echo something > file will write something to the file file . It's the same as echo something 1> file . Now, echo something 2> file will write the stderr output to file .
If you write echo something 2>1 , it means that you redirect stderr to a file with the name 1 . Add spaces to make it more clear: echo something 2> 1 .
If you add & before 1 , it means that 1 is not a filename but the stream ID. So it's echo something 2>&1 .

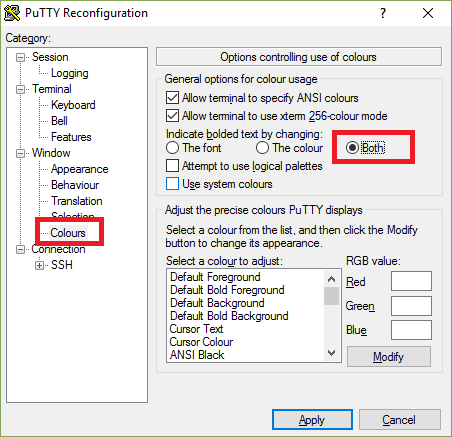
If you have missing elements in htop when you are using PuTTY, here is how to solve it.
- Right click on the title bar
- Click Change settings.
- Go to Window -> Colours
- Select the Both radio button
- Click Apply
Let's write a very simple shell in C that demonstrates the use of fork / exec / wait system calls. Here's the program shell.c .
Compile the program.
Have you ever wondered that when you launch a process in the background you only see that it has exited only after a while when you hit Enter ?
That's because the shell is waiting for your input. Only when you enter a command does it check for the status of the background processes and show if they've been terminated.
Here is what I'd like to find out more about.
- process state substatuses ( Ss , Ss+ , R+ , etc.)
- kernel threads
- /dev/pts
- more about memory ( CODE , DATA , SWAP )
- figure out time slices length
- Linux scheduler algorithm
- pinning proceses to cores
- write about manual pages
- cpu/memory colors in bars
- process ID limit & fork bomb
- lsof , ionice , schedtool
Here is a list of non-minor corrections and updates since the post was published.
- Idle time in /proc/uptime is the sum of all cores (Dec 2, 2016)
- My parent/child printf in zombie.c was reversed (Dec 2, 2016)
- apt remove cron installs postfix because of a dependency to an MTA (Dec 3, 2016)
- id can load information from other sources (via /etc/nsswitch.conf ), not just /etc/passwd (Dec 3, 2016)
- Describe /etc/shadow password hash format (Dec 3, 2016)
- Use visudo to edit the /etc/sudoers file to be safe (Dec 3, 2016)
- Explain MEM% (Dec 3, 2016)
- Rewrite the section about load averages (Dec 4, 2016)
- Fix: kill 1234 by default sends TERM not INT (Dec 7, 2016)
- Explain CPU and memory color bars (Dec 7, 2016)
Please let me know if there is something wrong in this post! I will gladly correct it.
Congratulations on making to the end.
Here's another screenshot of htop.
This time it's of a human. It displays your inner processes and the load of your kernel.
Get this t-shirt for yourself or as a gift.
It's been bought 44 times already (including hoodies, etc.)
Related posts
-
October 14, 2015 May 18, 2016 May 27, 2016 June 07, 2016 January 12, 2016 November 07, 2015
Top posts
-
December 09, 2016 November 17, 2016 August 15, 2016 August 11, 2016 May 27, 2016
Recent posts
-
November 23, 2019 October 08, 2017 April 14, 2017 February 17, 2017 February 08, 2017
© 2014, 2015, 2016, 2017, 2018, 2019 Pēteris Ņikiforovs RSS
All code written by me on this blog is licensed under the Apache 2.0 license.