Экспорт данных, использованных для создания визуализации
Не все данные могут быть просмотрены или экспортированы всеми пользователями. Существуют меры предосторожности, которые создатели и администраторы отчетов используют при создании панелей мониторинга и отчетов. Некоторые данные ограничены, скрыты или конфиденциальны и не могут быть просмотрены или экспортированы без специальных разрешений.
Кто может экспортировать данные
Если у вас есть разрешения на доступ к данным, можно просмотреть и экспортировать данные, которые Power BI использует для создания визуализации. Часто данные бывают конфиденциальными или доступны только конкретным пользователям. В таких случаях вы не сможете просматривать или экспортировать эти данные. Дополнительные сведения см. в разделе Ограничения и рекомендации в конце этого документа.
Просмотр и экспорт данных
Чтобы просмотреть данные, которые Power BI использует для создания визуализации, откройте их в Power BI. Вы также можете экспортировать данные в Excel в виде файла XLSX или CSV. Для экспорта данных требуется лицензия Pro или Премиум и права на редактирование набора данных и отчета. Если у вас есть доступ к панели мониторинга или отчету, но данные классифицируются как строго конфиденциальные, Power BI не позволит экспортировать данные.
Просмотрите видео, в котором показан экспорт данных из визуализации в отчете и сохранение их в файл XLSX с последующим просмотром в Excel. Затем сделайте то же самое, выполнив пошаговые инструкции, приведенные под видео. Обратите внимание, что в этом видео используется более старая версия Power BI.
В этом видео могут использоваться более ранние версии Power BI Desktop или службы Power BI.
Экспорт данных из панели мониторинга Power BI
Выберите "Дополнительные действия" (. ) в правом верхнем углу визуализации.

Выберите параметр Экспорт в CSV.

Power BI экспортирует данные в файл CSV. Если выполнить фильтрацию визуализации, экспорт CSV также будет отфильтрован.
Браузер предложит сохранить файл. Откройте сохраненный файл CSV в Excel.

Экспорт данных из отчета
Для начала откройте отчет по примеру анализа закупок в службе Power BI в представлении редактирования. Добавьте новую пустую страницу отчета. Затем выполните следующие действия, чтобы добавить агрегирование, иерархию и фильтры уровня визуализации.
Создание гистограммы с накоплением
Создайте гистограмму с накоплением.

В области Поля выберите Location > City (Расположение > Город), Location > Country/Region (Расположение > Страна/регион) и Invoice > Discount Percent (Счет > Процент скидки). Возможно, нужно будет переместить Discount Percent (Процент скидки) в область Значение.

Измените тип агрегации для процента скидки с количества на среднее значение. В области Значение щелкните стрелку справа от параметра Discount Percent (Процент скидки) (он может называться Count of Discount Percent (Число процента скидки)) и выберите значение Average (Среднее значение).

Добавьте фильтр к параметру City (Город), выберите все города, а затем удалите город Атланта.

Детализация на один уровень вниз в иерархии. Включите детализацию и выберите детализацию до уровня City (Город).

Теперь можно попробовать оба варианта для экспорта данных.
Экспорт сводных данных
Выберите вариант Сводные данные, если вы хотите экспортировать данные, которые отображаются в этом визуальном элементе. Этот тип экспорта отображает только данные (столбцы и меры), которые вы выбрали для создания визуального элемента. Если визуальный элемент содержит статистическое выражение, будут экспортированы объединенные данные. Например, если в гистограмме отображается четыре столбца, вы получите четыре строки данных Excel. Сводные данные доступны в службе Power BI в файлах XLSX и CSV и в Power BI Desktop в виде CSV-файла.
Щелкните многоточие в правом верхнем углу визуализации. Выберите пункт Экспорт данных.

В службе Power BI визуализация имеет агрегат (вы изменили параметр Число на среднее), поэтому у вас есть два варианта:
Сводные данные;
Базовые данные.
Дополнительные сведения о статистических выражениях см. в статье Статистические выражения в Power BI.
В Power BI Desktop вы можете экспортировать только сводные данные в виде CSV-файла.
В области Экспорт данных установите переключатель Сводные данные или выберите XLSX или CSV, а затем нажмите кнопку Экспорт. Power BI экспортирует данные.

При выборе элемента Экспорт браузер предложит сохранить файл. Откройте сохраненный файл в программе Excel. Если вы используете приложение Power BI в Microsoft Teams, вы можете не получить те же запросы. Экспортированный файл сохраняется в локальной папке "Загрузки".

В этом примере в экспортированных данных Excel отображается итоговая сумма для каждого города. Так как мы исключили Атланту, этого города нет в результатах. В первой строке электронной таблицы отображаются фильтры, которые служба Power BI использовала при извлечении данных.
Экспортируются все данные, используемые иерархией, а не только данные, используемые для текущего уровня детализации визуального элемента. Например, мы выполняли детализацию по уровню City, но наш экспорт включает также данные о стране.
Экспортированные данные агрегированы. Мы получаем итог, по одной строке для каждого города.
Так как мы применили фильтры к визуализации, экспортированные данные будут экспортированы с учетом фильтров. Обратите внимание, что первая строка отображает Примененные фильтры: город — не Атланта, штат Джорджия.
Экспорт базовых данных
Выберите этот вариант, если вы хотите просмотреть данные в визуальном элементе и _ дополнительные данные из набора данных (дополнительные сведения см. в диаграмме ниже). Если визуализация содержит статистическое выражение, при выборе варианта _ Базовые данные статистическое выражение удаляется. В этом примере в экспортированных данных Excel отображается по одной строке для каждой строки "Город" в наборе данных и процент скидки для одной записи. Power BI выполняет сведение данных, но не агрегирование.
Когда вы нажмете кнопку Экспорт, Power BI экспортирует данные в файл XLSX и браузер предложит сохранить этот файл. Откройте сохраненный файл в программе Excel.
Щелкните многоточие в правом верхнем углу визуализации. Выберите пункт Экспорт данных.
В службе Power BI визуализация имеет агрегат (вы изменили параметр Число на среднее), поэтому у вас есть два варианта:
Сводные данные;
Базовые данные.
Дополнительные сведения о статистических выражениях см. в статье Статистические выражения в Power BI.
В Power BI Desktop вы можете экспортировать только сводные данные.
В разделе Экспорт данных выберите Базовые данные, а затем выберите Экспорт. Power BI экспортирует данные.

При выборе элемента Экспорт браузер предложит сохранить файл. Откройте сохраненный файл в программе Excel. Если вы используете приложение Power BI в Microsoft Teams, вы можете не получить те же запросы. Экспортированный файл сохраняется в локальной папке "Загрузки".
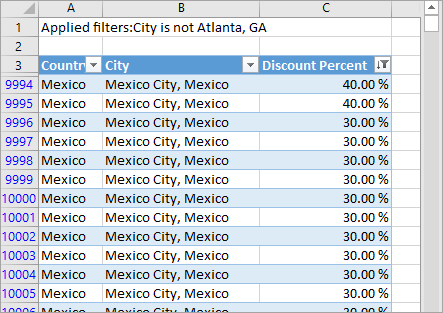
На этом снимке экрана показана только небольшая часть файла Excel. Он содержит более 100 000 строк.
Экспортируются все данные, используемые иерархией, а не только данные, используемые для текущего уровня детализации визуального элемента. Например, мы выполняли детализацию по уровню City, но наш экспорт включает также данные о стране.
Так как мы применили фильтры к визуализации, экспортированные данные будут экспортированы с учетом фильтров. Обратите внимание, что первая строка отображает Примененные фильтры: город — не Атланта, штат Джорджия.
Настройка процедуры доступа к данным экспорта
Пользователи, которым предоставлен доступ к отчету, получают доступ ко всему базовому набору данных, если только доступ не ограничен безопасностью на уровне строк (RLS). Для настройки взаимодействия с пользователями авторы отчетов и администраторы Power BI могут использовать описанные ниже возможности.
Администраторы Power BI могут отключить некоторые или все параметры экспорта данных для своей организации.
Владельцы наборов данных могут устанавливать безопасность на уровне строк (RLS). RLS предоставляет пользователям доступ только для чтения. Но если вы настроили рабочую область приложения и дали ее участникам разрешения на изменение, то роли RLS не будут применяться к этим участникам. Дополнительные сведения см. в разделе Безопасность на уровне строк.
Авторы отчетов могут скрывать столбцы, чтобы они не отображались в списке Поля. Дополнительные сведения см. в разделе Свойства наборов данных
Эти настраиваемые возможности не ограничивают данные, которые могут быть доступны пользователям. Используйте безопасность на уровне строк (RLS) в наборе данных, чтобы учетные данные каждого пользователя могли определять, к каким данным они имеют доступ.
Защита данных при экспорте из Power BI
Авторы отчетов могут классифицировать и помечать отчеты с помощью меток конфиденциальности Microsoft Information Protection. Если метка конфиденциальности имеет параметры защиты, Power BI применит их при экспорте данных отчета в файлы Excel, PowerPoint или PDF. Защищенные файлы могут открыть только авторизованные пользователи.
Администраторы безопасности и администраторы Power BI могут использовать Microsoft Cloud App Security, чтобы отслеживать доступ пользователей и осуществляемые ими действия, выполнять анализ рисков в реальном времени, а также задавать элементы управления для меток. Например, организации могут использовать Microsoft Cloud App Security для настройки политики, запрещающей пользователям скачивать конфиденциальные данные из Power BI на неуправляемые устройства.
Сведения об экспорте базовых данных
Данные, отображаемые при выборе варианта Базовые данные, могут различаться. Для понимания этих сведений может потребоваться помощь администратора или ИТ-отдела.
| Визуальный элемент содержит | Что вы видите при экспорте |
|---|---|
| Статистические выражения | Первое статистическое выражение и нескрытые данные из всей таблицы для этого статистического выражения |
| Статистические выражения | Связанные данные — если визуальный элемент использует данные из других таблиц данных, которые связаны с таблицей данных, содержащей статистическое выражение (если это связь типа *: 1 или 1:1) |
| Меры* | Все меры в визуальном элементе и все меры из любой таблицы данных, содержащей меру, используемую в визуальном элементе |
| Меры* | Все нескрытые данные из таблиц, содержащих эту меру (если это связь типа *: 1 или 1:1) |
| Меры* | Все данные из всех таблиц, связанных с таблицей, содержащей меры с помощью цепочки *: 1 из 1:1 |
| Только меры | Все нескрытые столбцы из всех связанных таблиц (для расширения меры) |
| Только меры | Сводные данные для всех повторяющихся строк для мер модели |
* В Power BI Desktop или в службе Power BI в представлении отчетов мера отображается в списке Поля со значком калькулятора . Меры можно создавать в Power BI Desktop.
Настройка параметров экспорта
Конструкторы отчетов Power BI управляют типами параметров экспорта данных, которые доступны для пользователей. Возможные варианты:
Разрешить пользователям экспортировать сводные данные из службы Power BI или Сервера отчетов Power BI
Разрешить пользователям экспортировать сводные и базовые данные из службы или Сервера отчетов
Запретить пользователям экспортировать данные из службы или Сервера отчетов
Мы рекомендуем конструкторам отчетов вернуться к старым отчетам и вручную сбросить параметр экспорта при необходимости.
Чтобы настроить эти параметры, сделайте следующее:
Запустите Power BI Desktop.
В левом верхнем углу выберите Файл > Параметры и настройки > Параметры.
В разделе ТЕКУЩИЙ ФАЙЛ выберите Параметры отчета.
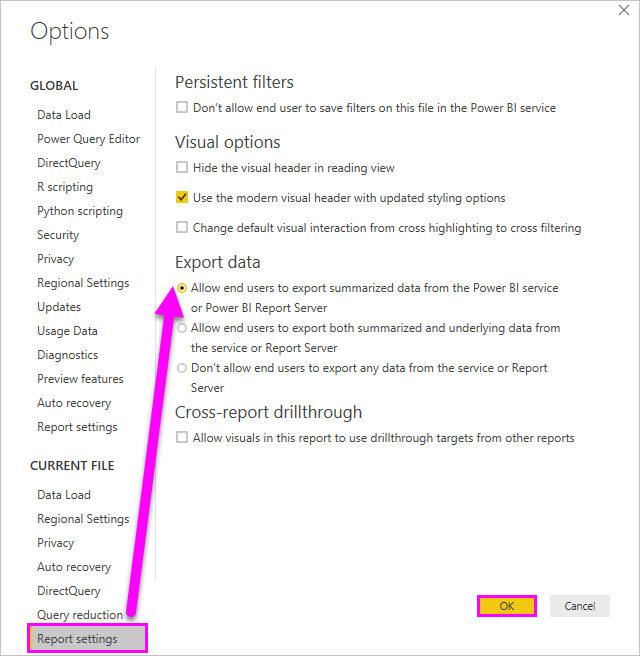
Выберите нужный вариант в разделе Экспорт данных.
Этот параметр также можно обновить в службе Power BI.
Учтите, что конфликтующие параметры портала администрирования Power BI переопределяют параметры отчета для экспорта данных.
Рекомендации и ограничения
Эти ограничения и рекомендации применяются к Power BI Desktop и службе Power BI, включая Power BI Pro и Premium.
Чтобы экспортировать данные из визуального элемента, вам нужно иметь разрешение на сборку для базового набора данных.
Максимальное число строк, которые Power BI Desktop и служба Power BI могут экспортировать из отчета режима импорта в файл CSV, составляет 30 000.
Максимальное число строк, которые приложения могут экспортировать из отчета режима импорта в файл XLSX, составляет 150 000.
Экспорт с использованием базовых данных не будет выполняться, если:
используется более ранняя версия, чем версия 2016;
для таблиц в модели нет уникального ключа;
администратор или конструктор отчетов отключил эту функцию.
Экспорт с использованием базовых данных не будет работать, если вы включите параметр Показать элементы без данных.для визуализации, которую экспортирует Power BI.
При использовании DirectQuery максимальный объем данных, который Power BI может экспортировать, составляет 16 МБ несжатых данных. Непреднамеренным результатом может быть то, что вы экспортируете меньше, чем максимальное количество строк (150 000). Это вероятно, если:
существует очень много столбцов (попробуйте уменьшить число столбцов и повторите экспорт);
существуют данные, которые сложно сжать;
существуют другие факторы, из-за которых увеличивается размер файла и уменьшается количество строк, которые Power BI может экспортировать.
Если визуализация использует данные из нескольких таблиц данных и для этих таблиц в модели данных не существует активных связей, Power BI экспортирует только данные для первой таблицы.
Пользовательские визуальные элементы Power BI и визуальные элементы R сейчас не поддерживаются.
В Power BI вы можете переименовать поле (столбец), дважды щелкнув его и введя новое имя. Power BI рассматривает новое имя как псевдоним. В отчете Power BI в итоге могут оказаться повторяющиеся имена полей, однако в Excel они запрещены. Поэтому когда Power BI экспортирует данные в Excel, псевдонимы заменяются исходными именами полей (столбцов).
Если в файле CSV содержатся знаки Юникода, то текст в Excel может отображаться неправильно. Примерами знаков Юникода являются символы валют и иностранные слова. Вы можете открыть файл в Блокноте, чтобы знаки Юникода отобразились правильно. Если вы хотите открыть файл в Excel, необходимо импортировать файл CSV. Чтобы импортировать файл в Excel, сделайте следующее:
Перейдите на вкладку Данные.
Выберите Получение внешних данных > Из текста.
Перейдите к локальной папке, где хранится файл, и выберите файл CSV.
При экспорте в формат CSV некоторые символы будут экранированы с символом ‘ в начале, чтобы предотвратить выполнение скрипта при открытии в Excel. Это происходит в следующих случаях:
- Столбец определен как тип "Текст" в модели данных и.
- Первый символ в тексте является одним из следующих: =, @, +,-
Администраторы Power BI могут отключить экспорт данных.
Если к мере применяется строка динамического формата, экспортированные данные не сохранят это форматирование в Excel. Кроме того, в Excel не сохраняется специфичное для визуального оформления форматирование, например процент от общего итога для меры.
Exporting Data from Power BI Desktop to Excel and CSV – Part 1: Copy & Paste and DAX Studio Methods

If you’re interested in exporting the data model from either Power BI Desktop or Power BI Service to CSV or SQL Server check this out. The method explained here is only applicable for Power BI Premium or Embedded capacities with XMLA endpoints connectivity.
One of the features that is asked a lot on Power BI community is how to export Power BI desktop data to Excel OR CSV.
Note: I’d like to make it clear that in this article we are NOT interested in exporting data from a visual in a report to CSV.
The first question lots of you might have is “How on earth someone wants to export data from a Power BI Desktop model to Excel OR CSV?”.
Power BI brings Power Query, Power Pivot, Power View and Power Map together in one piece of software. So why not using Excel at the first place to load data from the source? There might be lots of other questions about the reasons that someone wants to export data from Power BI Desktop model to Excel (or any other destinations). The reason could be one of the following that someone wants to export data from Power BI Desktop model to other destinations like Excel, CSV, SQL Server etc.
- For some reason you have just a Power BI Desktop file (PBIX) and you don’t have access to the data sources and you need to provide the data to someone who is not familiar with Power BI
- You Power BI Desktop consolidates lots of different sources in a single model and it would be very hard to get the same output as you get in Power BI Desktop model in Excel. So an export feature can be super handy
- You might have done lots of complex transformations in Power BI Query Editor and replication the same logic on the source system could be much more complex and time consuming, so again exporting data from a current Power BI Desktop model makes sense
- You have a bunch of calculated columns created in DAX and you don’t want to go back and redo all the hard works you have already done in Power BI in another environment like Excel
- You might want to use the current Power BI data in Cortana Analytics
- You are just curious to see if it is possible
- None of the above!
But, the reality is that regardless of the reason, lots of people still want to export data from Power BI Desktop to different destinations. So let’s have a look at different workarounds until this feature is not available in Power BI. I’ll explain different ways to export Power BI Desktop data in a series of articles. In this post you learn how to copy Power BI Desktop data to a destination file like Excel or CSV without any third-party software involved. I also explain how easy you can export Power BI Desktop data to CSV using DAX Studio.
Copy Data from Data View in Power BI Desktop and Paste it to Destination
The easiest workaround is simply copy/paste data from Data view in Power BI Desktop.
- Open your Power BI Desktop model
- Switch to Data view by clicking on Data tab
You have now 3 options to copy data:
- Right click on a desired table and click “Copy Table”
- Click a desired table then from the ribbon, click “Copy”
- Click a desired table, right click on data area then click “Copy Table”
- Now open a new Excel file and paste the copied data
- You can copy the entire table, including all DAX calculated columns, very easily and paste it on a destination like Excel or a text editor and save it as TXT or CSV files
- You copy transformed and probably cleansed data in case you have done any data transformation in Query Editor
- No third party tool is needed/involved
- If for any reason you want to paste the data in SQL Server, this might not be the best way to get the job done
- This way is good for small volume of data. If you want to copy a larger amount of data than some thousands rows, say even 64,000 rows, then the copy process might take a long time
- There is always a risk of missing data as we are copying data into Windows clipboard
Copy Data from Query Editor in Power BI Desktop and Paste it to Destination
Another easy workaround is to copy data from Query editor:
- On Power BI Desktop click “Edit Queries” to open Query Editor
- Select a desired query
Now you have 2 options:
- Click on the tiny table button located on the top left of the table and click “Copy Entire Table”
- Press Ctrl+A to select all columns, then press Ctrl+C to copy data or right click on a column header and click “Copy”. You can select multiple columns by pressing Ctrl and clicking on column headers in case you don’t want to copy the entire table.
You can also select different levels of data transformation to be copied.
- Now you can paste the data to Excel
- You can copy the entire table, very easily and paste it on a destination like Excel or a text editor and save it as TXT or CSV files
- You can copy multiple selected columns rather than copying the entire table
- Not only can you copy transformed data in case you have done any data transformation in Query Editor, but also you can decide which level of transformed data should be copied
- No third party tool is needed/involved
- DAX calculated columns are NOT included
- If you use Ctrl+A, you select all columns to be copied which includes complex columns automatically added to the table. For a table like DimDate which potentially has lots of relationships with other tables, you probably don’t like it.
- It’s not that easy to export data in other destinations like SQL Server
- Poor performance in copying large amount of data
- Risk of missing data as we are copying data into Windows clipboard
Export Data from Power BI Desktop to CSV or TXT Using DAX Studio
Update: If you’d like to export the model data as a whole, check this out.
Exporting data from Power BI Desktop to CSV using DAX Studio is super easy. An advantage of using DAX Studio is that it works great regardless of the amount of data you want to export. The other advantage is that you can literally export a query output to CSV which can be very helpful if you don’t want to only export the entire table, but a specific query.
Here is how to get the job done in DAX Studio:
- Open a desired Power BI Desktop model
- Open DAX Studio
- Click “PBI / SSDT Model” then select your Power BI model from the list then click “Connect”
- Write a desired DAX query, I’m not going to explain DAX query language in this article, but you can simply write “EVALUATE TABLE_NAME” which “TABLE_NAME” is the name of the table you want to export. So in our case it is “FactInternetSales”
- Run, or press F5, to execute the query
- Click “Results” tab and make sure you get the expected results
- Click “Output” from the ribbon and select “File”
- Run the query
- Select a folder and enter file name to save the results in TXT or CSV then click “Save”
- Now DAX Studio start writing data into the output file
- After DAX Studio finished writing data you may open the file
Bottom line: You can easily copy/paste your Power BI Desktop data to a destination like Excel or notepad from Power BI Desktop as explained above. You can also export Power BI data using DAX Studio to CSV very easily. However, the first approach it is useful only when you want to copy small amount of data. DAX Studio is super easy and very powerful tool to export data from Power BI Desktop to CSV or TXT files. But, what if you need to load more data to Excel or even SQL Server?
In my next post I’ll explain how to directly import Power BI Desktop data to Excel, so stay tuned. 
Power BI Export Data – Complete tutorial
In this Power bi tutorial, we will learn about What is export to in power bi desktop. And also we will discuss the below points:
- Who can export data in power bi?
- Different types of exporting data options in Power BI
- How do I enable export data in Power bi
- Power bi desktop export to excel
- Power bi desktop export table to excel
- Power bi desktop export to excel limit
Table of Contents
What is export to in Power bi desktop?
- The export to feature in power bi desktop is used to export the data which is used to create the visualization to Excel or CSV.
- The export to features requires the pro and premium license as well as it requires edit permission to the dataset and report.
Who can export data in Power bi?
- If the user has the permissions to the data, then only the user can see and export data that power bi uses to create the visualization. Not all the data can be viewed or exported by all users in power bi desktop
- Often in power bi, data is confidential or limited to specific users. In all those cases the user will not be able to see or export the data.
Different types of exporting data in Power bi
There are two different types of exporting data in power bi these are
- Export Summarized data
- Export Underlying data
Export Summarized data
- This type of export in power bi, shows only the data having column and measure, that are used to create visual.
- If the power bi visual has an aggregate, you can export the aggregated data by using the export summarized data feature.
- Summarized data feature is available in power bi service as .xlsx and .csv and in power bi desktop as .csv
- Select the option for summarized data in power bi, if you want to export data that you see in that visual.
Export Underlying data
- If your power bi visualization has an aggregate, select the underlying data that removes the aggregate.
- Select this option, when you want to see the data present in the power bi visual and additional data from the datasets. And this feature is only available in power bi service.
How do I enable export data in Power bi?
Here we will see how to export data in power bi. The power bi report designer controls the types of data export options that are available for the user/ consumer. The options are:
- Allow end-users to export summarized data from the power bi service or power bi report server.
- Allow end-users to export both summarized and underlying data from the power bi service
- Don’t allow end-users to export any data from the power bi service.
Let’s enable export data in power bi desktop
- Open power bi desktop.
- Click on the Files -> options and setting -> options in power bi desktop.

- Under Current File, click on the Report setting.
- Under Export data, select Allow end-users to export summarized data from the power bi service or power bi report server. Click on Ok.

In this way you can enable export data in power bi.
Power bi desktop how to export to excel
Here we will see power bi desktop how to export to excel in three ways
- Export data to excel from power bi desktop
- Export data from power bi dashboard
- Export data from power bi report
Export data to excel from Power bi desktop
Here we will see how export data to excel from power bi desktop.
- In the power bi desktop, select the visualization which you want to export.
- When you select the visual in canvas, you will see the more icon(…), click on it.
- Select Export data from the options.
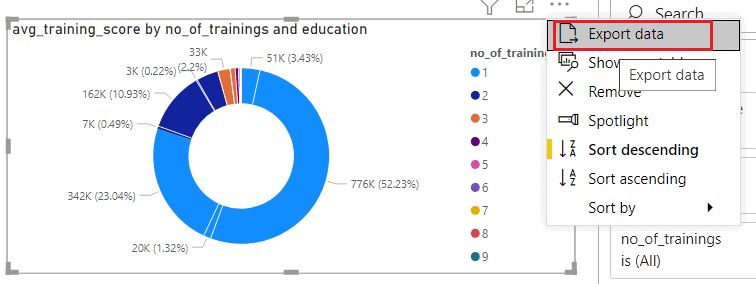
- Then it will show you to save it as a .csv file in your local computer. Now choose the location where you want to save the excel file, and select the excel file type as CSV. Then click on Save.

- Open your excel file on power bi desktop, in the below screen-shot you can see the data.

Export data from Power bi dashboard
Here we will see how to export data from power bi dashboard in power bi service.
- In power bi service, open the dashboard
- Select the visualization and click on the More icon(…).
- From the option select Export Data.

- In the Export dialog box, under which data would you like to export, click on summarized data, and under file format select .xlsx. And then click on Export.

- Now in your local download folder on your desktop, you can see the downloaded Excel file, click on it. In the below screen-shot you can see the downloaded excel file.

Export data from power bi report
Let’s see how to export from power bi report. And it is similar to Export data to excel from power bi desktop. The difference between them is here you have to export data from the browser instead of power bi desktop.
- Open report in power bi service
- Select the visualization and then click on the More icon(…) -> Export data.

- In the Export dialog box, under which data would you like to export, click on summarized data, and under file format select .xlsx. And then click on Export.

- Now in your local download folder on your desktop, you can see the downloaded Excel file, click on it. In the below screen-shot you can see the downloaded excel file.

Power bi desktop export table to excel
Here we will see how power bi desktop export table to excel and also we will discuss the pros and cons of power bi desktop export table to excel.
- Open your power bi desktop.
- Go to the Data tab in power bi desktop, in the field pane.
- Right-click on the table, and then select copy table.

- In excel blank sheet, paste the table you have copied from the power bi desktop.
- In the below screenshot, you can see the export table to excel from the power bi desktop.

Pros of Power bi desktop export table to excel
- User can copy transformed and clean data in the case have done any data transformation in Power Query editor.
- Users can copy the entire table, including all DAX calculated columns very easily and paste it on Excel and save it as a .csv or .xlsx.
- No third-party tool is needed to export the table from power bi desktop to excel.
Cons Power bi desktop export table to excel
- This is a good way if users want to export a small volume of data. But if the user wants to export a large amount of data then it takes a long time to load.
- If for any reason users want to export data to an SQL server, then this might not be the best way to get the job done.
Power bi desktop export to excel limit
Let discuss about power bi desktop export to excel limitation. And these limitation is also applied for power bi service, power bi pro and also for power bi premium.
- In power bi desktop and power bi service, the maximum number of rows that can export from an import mode report to a .csv file is 30,000.
- In power bi desktop and power bi service, the maximum number of rows that can export from an import mode report to a .xlsx file is 150, 000.
- In power bi to export the data from a visual, you need to have build permission for the underlying datasets.
- In power bi export using underlying data won’t work:
- if the version is older than 2016.
- if the table in the model doesn’t have a unique key.
- If the administrator or report designer has disabled this feature.
- If there are too many columns and try to reduce the number of columns while exporting.
- If there is data that is difficult to compress. If the other factors will increase the file size and decrease the number of rows power bi can export.
- Open Excel
- Go to the Data tab
- Select Get external data -> From text.
- Then go to the local folder where the file is stored and select the .csv file
- The field(column) is defined as type “text” in the data model, and
- If the first character of the text is one of the following: =, @, +, –
You may like the following Power BI tutorials:
In this power bi tutorial, we discuss Power bi export data using Power BI desktop. And also we discussed the below points:
- Who can export data in power bi?
- What are the different types of exporting data?
- How do I enable export data in power bi
- Power bi desktop how to export to excel
- Power bi desktop export table to excel
- Power bi desktop export to excel limit
After working for more than 15 years in Microsoft technologies like SharePoint, Office 365, and Power Platform (Power Apps, Power Automate, and Power BI), I thought will share my SharePoint expertise knowledge with the world. Our audiences are from the United States, Canada, the United Kingdom, Australia, New Zealand, etc. For my expertise knowledge and SharePoint tutorials, Microsoft has been awarded a Microsoft SharePoint MVP (9 times). I have also worked in companies like HP, TCS, KPIT, etc.
Как выгрузить данные из power bi в excel

Power BI, the solution developed by Microsoft, allows you to create data models and then turn them into dynamic, interactive reports that are easily accessible to your intended recipients.
Although Power BI is being increasingly used by finance professionals, teams still have to produce static reports in Excel to format and analyze their data. So how do you export data from Power BI to Excel?
In this article Roxanne, Power BI consultant at F31 will walk you through the different methods available to export Power BI to Excel:
Option 1: Export data from a Power BI visual to Excel with “Export Data”
Here is how to export data from an online Power BI report to Excel:
- Go to app.powerbi.com and choose a report you have access to
- Click on “…” at the top right of the desired visual, then click the “Exportdata” button
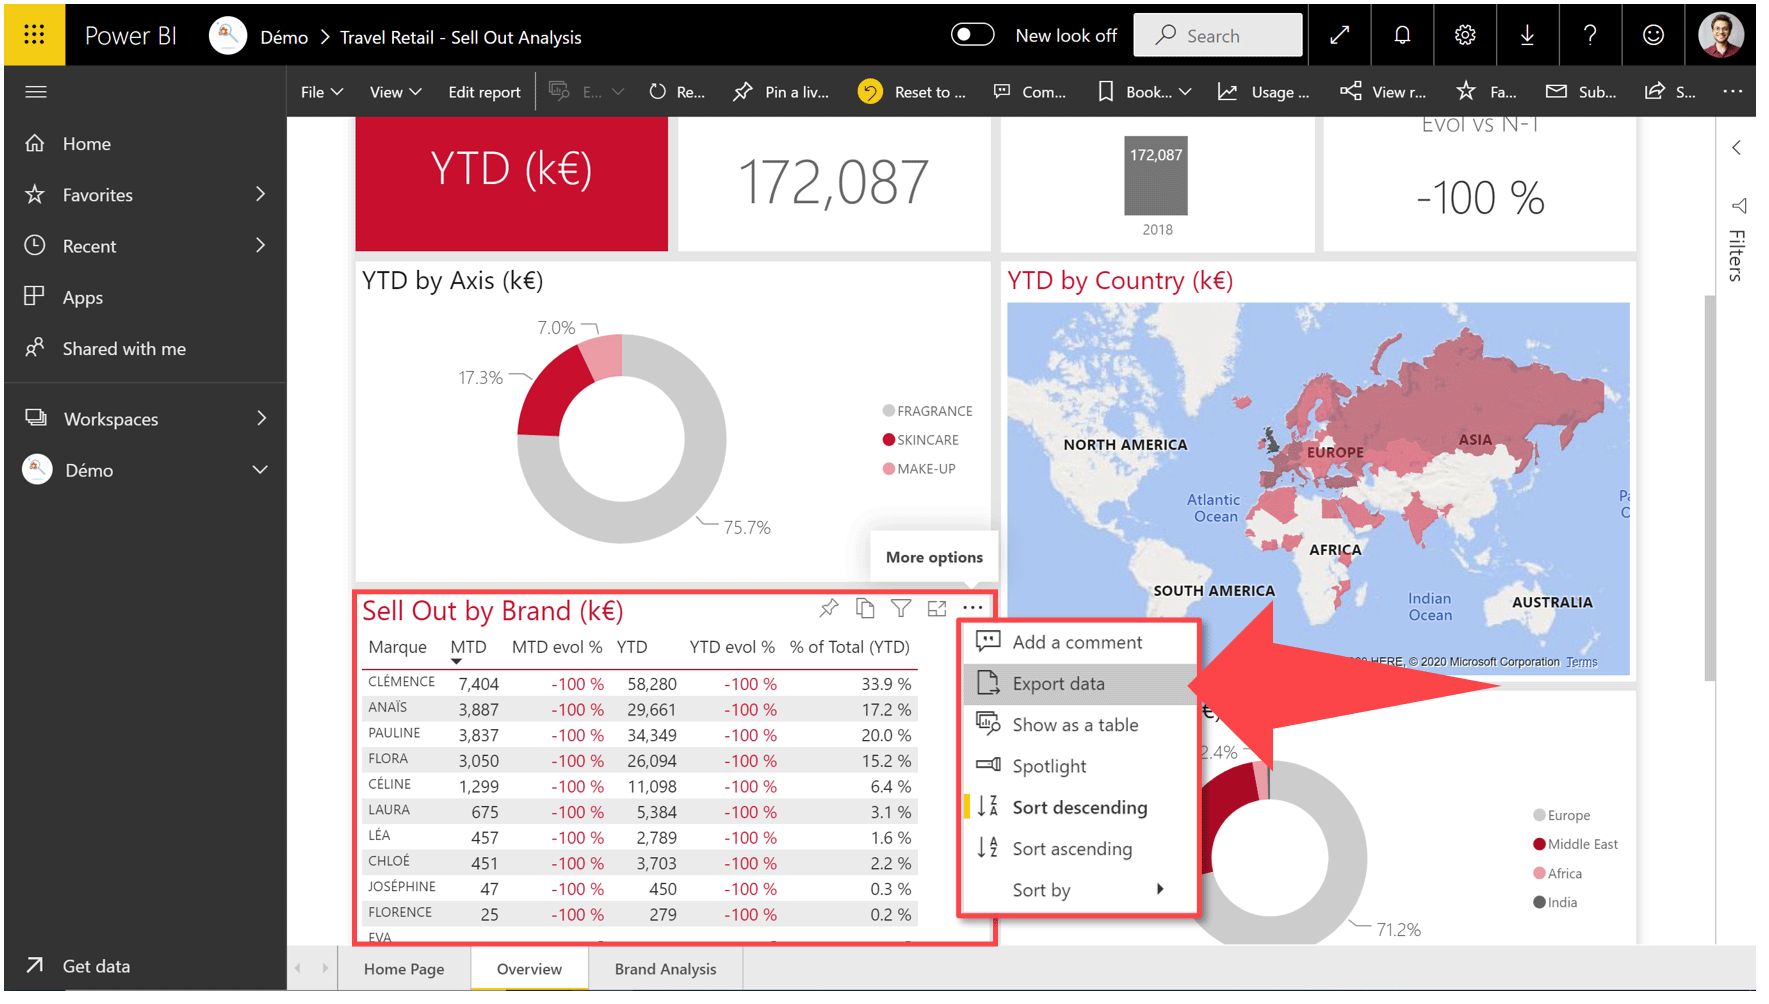
- Choose between downloading a CSV or XLSX file containing the data relating to the visual
- By default, you will only have access to the data filtered by the “Summarized data” view – depending on your rights, you can also export underlying data (unfiltered data) by choosing “Underlying data.”
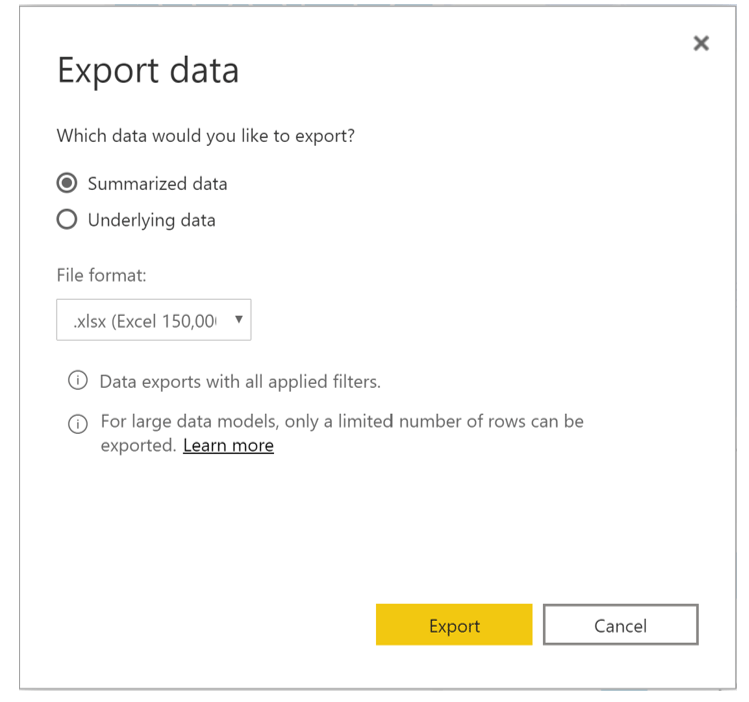
You can now edit your data or re-make graphs directly in Excel.
This first type of Power BI export to Excel is simple but limited as:
- You can only export data from one visual at a time, in a new CSV.
- You cannot update the data in Excel as the Power BI report evolves.
- You can only export data related to a Power BI visual, it is not possible to extract a table, because the data and the model cannot be viewed in the published version.
However, it is possible to export a table from the Power BI desktop to Excel: in the “Data” view, select a table, then right-click and “Copy” for a column, or “Copy Table” for the entire table. Simply paste the data into an Excel file to retrieve it.
Option 2: Export large data sets from Power BI to Excel with “Analyze in Excel”
The second way to export data from Power BI to Excel can handle whole data models, plus offers the advantage of being able to refresh the data directly in Excel! This will help when you want to export large amounts of data.
Here is how to connect your data model to a blank Excel file with the “Analyze in Excel” function:
- Go to app.powerbi.com
- Open the report which contains the data set you want to export
- Click “…” to the far right of the ribbon above the report
- Select “Analyze in Excel”

This downloads an Excel file in .ODC (Office Data Connection: an extension stored using HTML and XML) version. From here you can create PivotTables, visuals, etc. directly in Excel from the data derived from the Power BI data cube.
For example, when you want to create a new PivotTable in the Excel file (“Insert” > “PivotTable” tab), simply choose “Use an external data source” and then connect to the desired data cube by clicking on “Choose Connection.”

To refresh the data from the Power BI report, simply go to the “Data” tab and click on “Refresh All.”

This second type of Power BI export to Excel has the advantage of being semi-dynamic, yet it’s still limited as:
- It generates a new file, with an unfamiliar extension (.ODC, while Microsoft recommends to use the .XLSX extension).
- Measurements from data models must be created beforehand as it is not possible to create them in a PivotTable.
Option 3: “Get Data” from within Excel
Here’s how to access Power BI data from within Excel:
- Go to the Excel “Data” tab and select “Get Data”
- Choose “From Power BI” in the drop-down menu
- Select a dataset from the right-hand pane to create a PivotTable in Excel
- Choose fields from the PivotTable Field List to display

Whilst this is a quick, easy way to export data from Power BI to Excel, it isn’t the most efficient.
This is because selecting fields from a PivotTable Field List can make it difficult to visualize and understand the data set, especially if you didn’t create the Power BI dashboard yourself. Clicking through the various PivotTable fields to create your intended table in Excel could cost more time in the long run.
What is the best way to export Power BI to Excel?
Option 1: Export data from a Power BI visual – it is useful when you are simply looking to obtain the data underlying a visual on a Power BI report.
Option 2: Analyze in Excel – it is more suitable if you want to study your Power BI datasets. By importing the entire dataset, you have more flexibility, as long as you make sure that your metrics are created in advance so you can use them in your tables and graphs.
Option 3: Get Data from within Excel – it’s a relatively quick and easy way to export Power BI data to Excel. However, if you didn’t create the Power BI dashboard yourself, selecting the correct PivotTable fields could be time-consuming.
How to export Power BI to PowerPoint or Word
Good news! You can now export Power BI visuals to PowerPoint or Word using UpSlide’s Power BI Link! This feature allows you to access your Power BI reports and dashboards directly from PowerPoint or Word, choose the visuals you need and insert them into your presentation in a few clicks.
Once your Power BI is linked to your PowerPoint or Word, you can also update your entire presentation or specific visuals with the latest data by simply clicking the ‘Update Links’ button.
UpSlide’s Power BI Link enables you to reduce your time spent on low value-added tasks and be sure the data in your presentation is always up-to-date.